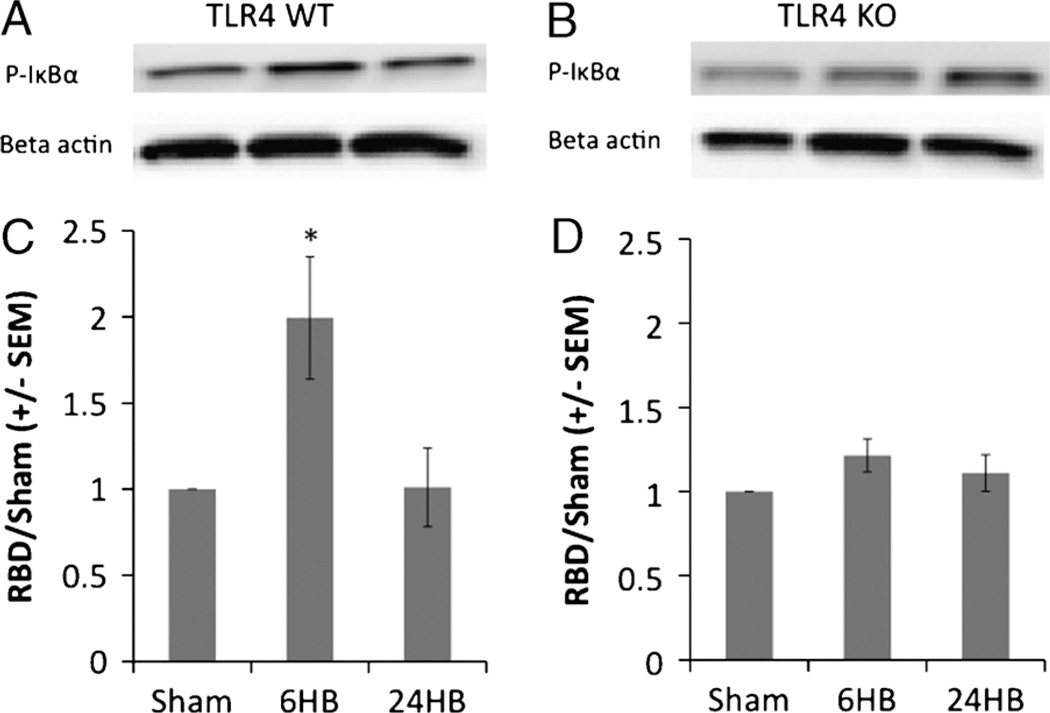
Fig. 3. Cytoplasmic phosphorylated IκBα levels.
P-IκBα levels are increased 6 h after burn in TLR4 WT animals. A and B demonstrate representative Western blots for cytoplasmic P-IκBα levels and β-actin loading control proteins. P-IκBα levels were significantly increased 6 h after burn in TLR4 WT animals (P < 0.05 compared with TLR4 WT sham) (C). No difference in P-IκBα levels was seen in TLR4 KO animals between time intervals (D). At least four animals were used per group.

