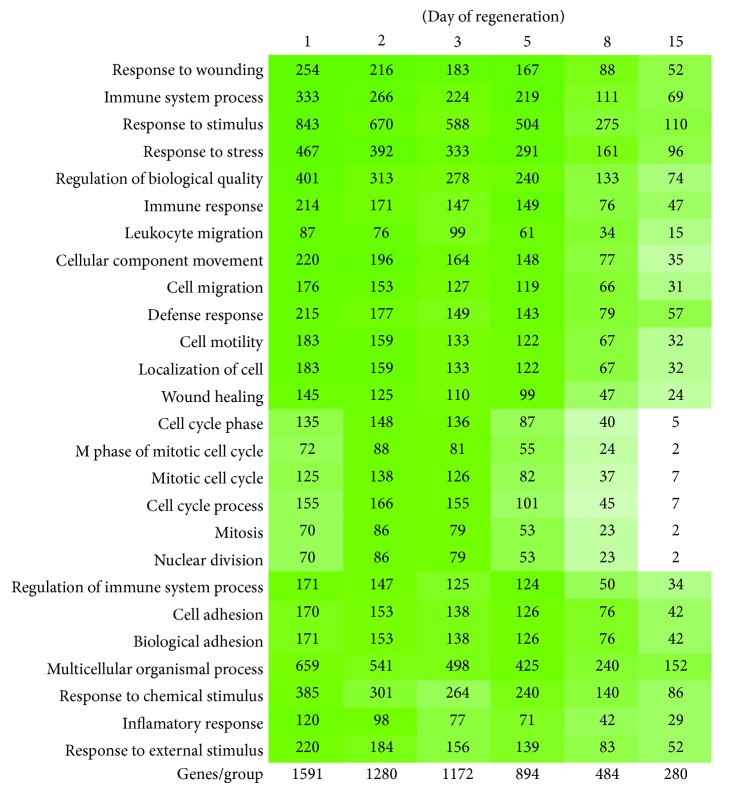
Figure 1.
Affymetrix Rat Gene 1.1 ST Array. Ontology analyses of up-/downregulated genes (fold >2, P < 0.05) using GeneAnswer (part of the R project) based on Gene Ontology database. On the left side functional categories were placed, on the bottom of the graph—total number of genes up-/downregulated during adrenal regeneration. Genes with changed expression (fold >2, P < 0.05) compared to control were grouped in functional categories. In each category hypergeometric statistical test was performed. Green color—statistically significant changes of expression (P < 0.05). If P value is lower, green color is more intense. It should be emphasized that GO database is composed of some general as well as specific categories with similar meanings and therefore a single gene may be mapped to several GO terms and may be counted more than ones.

