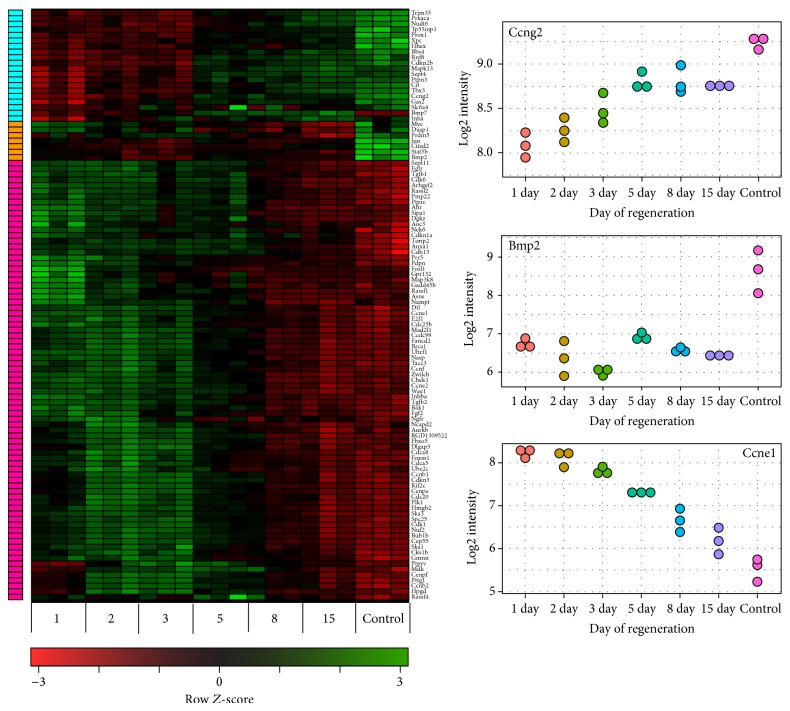
Figure 4.
Heat map representation of microarray analysis for the 106 transcripts of genes involved in cell cycle, with the highest differential expression in regenerating adrenals (versus control glands), independent of the day of change (days 1, 2, 3, 5, 8, and 15 of experiment). Signal intensity acquired from microarray analysis is represented by colors (see color key). Green color—increase of expression, red—decrease. Studied genes were clustered by means of hierarchical clustering algorithm. The following clusters were obtained: 20 genes with the highest expression between days 5 and 15 of regeneration (pink); 7 genes with the highest expression in control glands (orange); 79 genes with the highest expression at days 1 to 5 of experiment (blue). C—control animals. Dot-plot graphs present profile expression of 3 genes (Ccng2, Bmp2, and Ccne1) which are representatives for each heat map cluster.

