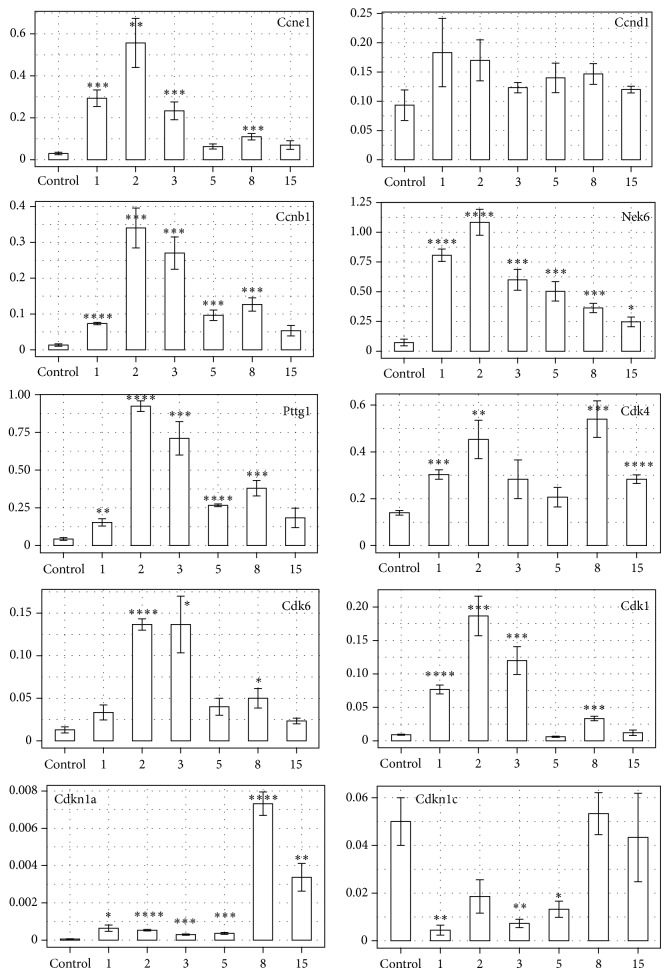
Figure 5.
QPCR assay of Ccne1, Ccnd1, Ccnb1, Nek6, Pttg1, Cdk4, Cdk6, Cdk1, Cdkn1a, and Cdkn1c mRNA expression in the regenerating rat adrenal cortex compared to control adrenals. Bars represent mean ± SEM (n = 3). All samples were amplified in triplicate, and HPRT gene expression was used as reference to normalize data. Statistically significant differences in relation to control group: * P < 0.05; ** P < 0.02; *** P < 0.01; **** P < 0.001.

