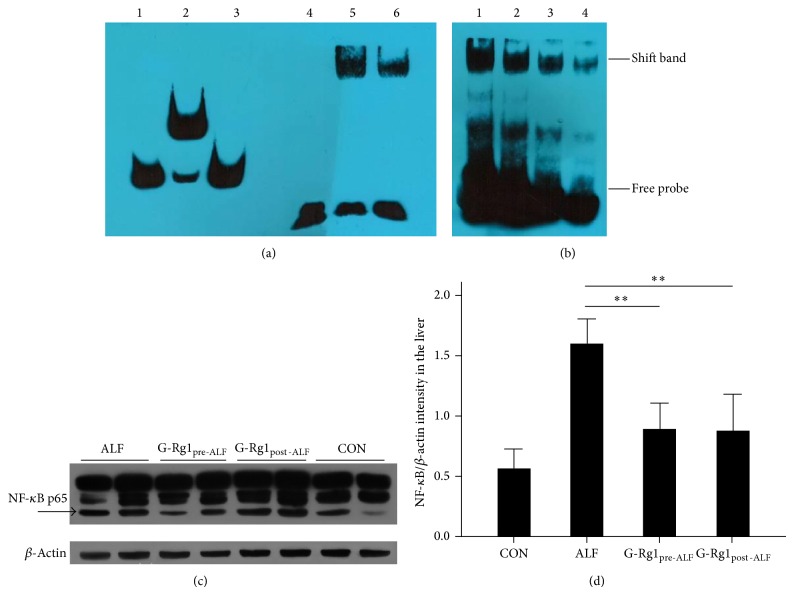
Figure 3.
NF-κB p65 DNA binding activity and expression. (a) Electrophoretic mobility shift assay (EMSA): bands 1–3 contain Epstein-Barr nuclear antigen- (EBNA-) based controls from the LightShift Chemiluminescent EMSA Kit (Thermo Scientific, USA); band 1, biotin-EBNA control DNA that establishes the position of an unshifted probe band; band 2, biotin-EBNA control DNA + EBNA extract containing sufficient target protein to shift the biotin-EBNA DNA; and band 3, biotin-EBNA control DNA + EBNA extract + 200-fold excess of unlabeled EBNA DNA demonstrating signal shift is prevented by competition from excess nonlabeled DNA. Band 4 contains only biotin-labeled probes. Band 5 contains biotin-labeled probes and nucleoprotein from normal liver cells. Band 6 contains biotin-labeled probes, unlabeled probes, and nucleoprotein from normal liver cells; the biotin-labeled and unlabeled probes compete in binding to the nucleoprotein. Band 6's signal is weaker than band 5's signal, since a lesser amount of competitively binding unlabeled probes was added to band 6. (b) EMSA: the ALF group (band 1) had the highest density shift band. The G-Rg1pre-ALF group (band 2) showed a lower density shift band followed by the G-Rg1post-ALF group (band 3) and the CON group (band 4). NF-κB p65 DNA binding activity was the highest in the ALF group. G-Rg1 treatment significantly reduced NF-κB p65 DNA binding activity in both the G-Rg1Pre-ALF and G-Rg1Post-ALF groups relative to the ALF group. (c, d) Western blotting revealed significant decreases in NF-κB p65 expression in the G-Rg1Pre-ALF and G-Rg1Post-ALF groups relative to the ALF group (n = 5, ** P < 0.01). The graph in (d) displays the average OD values for NF-κB p65 for each experimental group derived from Western blotting experiments run in triplicate.

