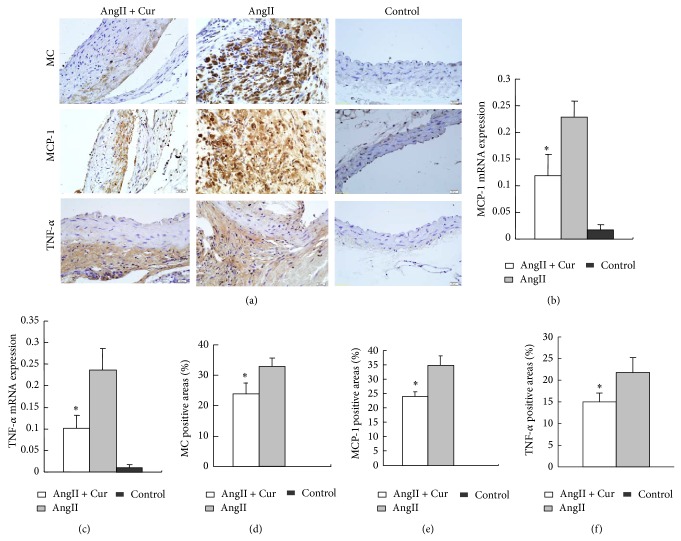
Figure 3.
Macrophage, MCP-1, and TNF-α gene and protein expression by RT-PCR and immunostaining in three groups. (a) Immunostaining (scale bars equal 20 μm, 400x) of abdominal aortic cross-section in three groups for macrophages (MC, macrophage) (top row), MCP-1 (second row), TNF-α (third row). ((b) and (c)) MCP-1 and TNF-α mRNA expression by real-time RT-PCR, * P < 0.01 versus AngII group. ((d), (e), and (f)) Quantification of the positive staining area of macrophages, MCP-1, and TNF-α. * P < 0.01 versus AngII group.

