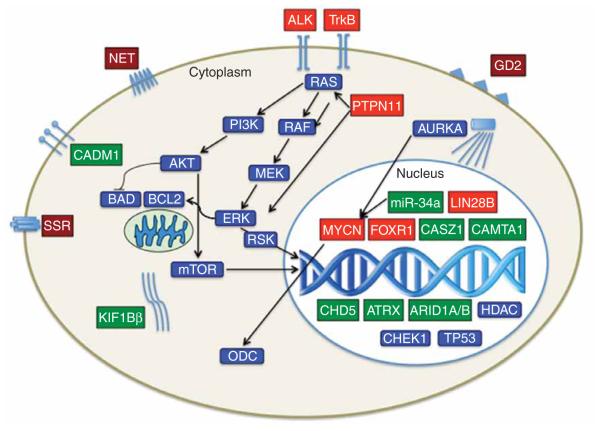
Figure 1. Diagrammatic representation and intracellular location of therapeutic targets of NB.
Activated genes and their encoded proteins are shown in red; inactivated genes/proteins are shown in green; selectively expressed membrane proteins (e.g., NET, GD2) are shown in burgundy; and common targets relevant to NBs and other cancers are shown in blue.

