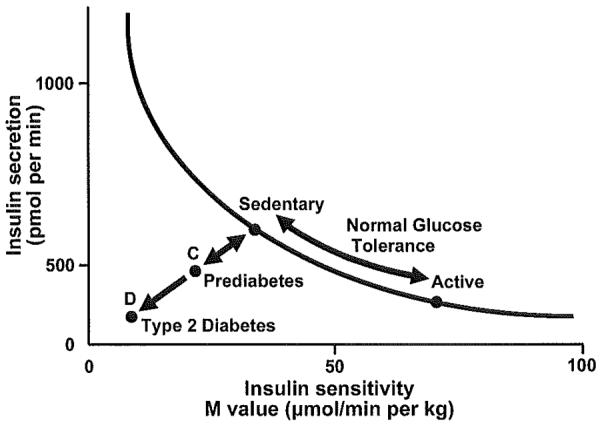
Fig. 12.

Insulin secretion is presented as a function of insulin sensitivity. Insulin secretion rises as insulin sensitivity falls when physically active individual (point A) becomes sedentary (point B). A failure of insulin secretion to compensate for fall in insulin sensitivity is noted when both insulin secretion and insulin sensitivity decline from point B to point C, indicating prediabetes. The upper axis for increased and decreased levels of physical activity implies bidirectionality of the two arrows for glucose intolerance and insulin resistance. The leftward enlarging two arrows illustrate increasing glucose intolerance and insulin resistance with 2–3 days of decreased physical activity. The clinical significant is that low levels of physical activity produce a permissive environment for prediabetes. In opposite direction, high levels of daily physical activity markedly diminish the permission state to develop prediabetes. The distinction between the two arrows is based upon variability in Masters athlete's responses to stopping training as shown in figure 2 of ref (443) in which 4 subjects had lesser increases in blood insulin (insulin resistance arrow) at 30 min into an oral glucose tolerance test as compared to 10 other subjects (glucose intolerance arrow). A continued decline in both insulin secretion and insulin sensitivity at point D is where overt type 2 diabetes is present. Reproduced with permission from Bergman's original figure (ref 36).
