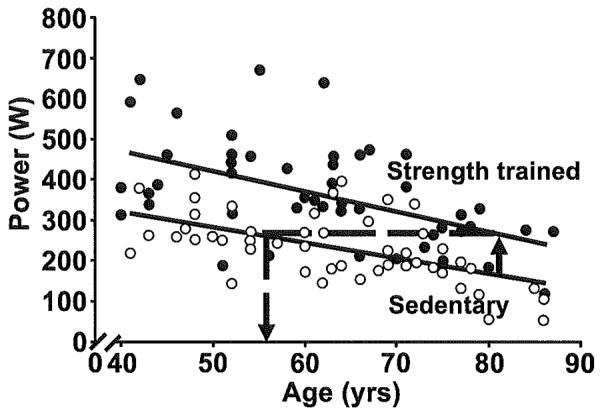
Figure 6.

Best-fit linear lines are shown for power of two cross-sectional groups (strength trained and sedentary) as a function of their increasing chronological age. At the chronological age of 80 yrs, a horizontal line is extended from the power-trained line to the left where it intersects the sedentary line at age 56 yrs. The cross-sectional strength-trained subjects are shown in closed circles and sedentary in open circles. [Reproduced with permission from (402)].
