
Figure 8.
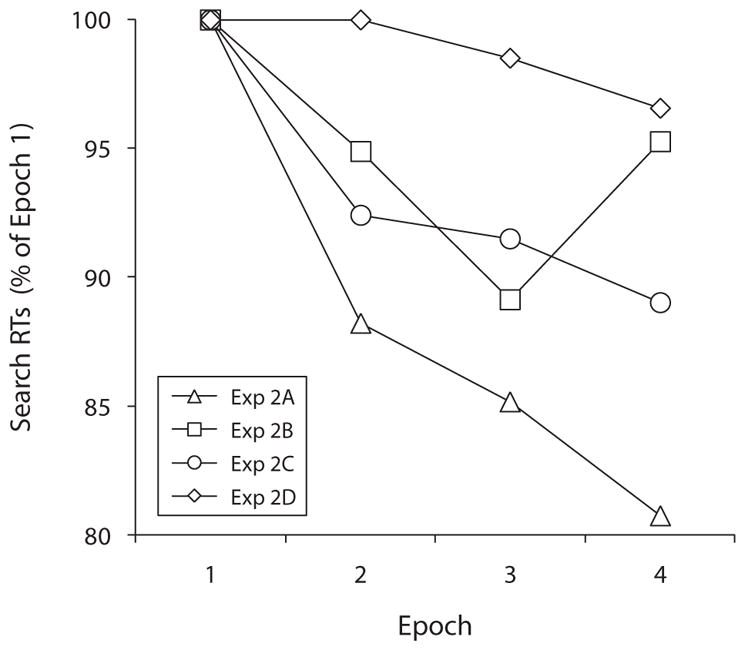
Time series analysis showing mean visual search response times (rTs) as a function of experiment and epoch in Experiment 2. The results are scaled to the proportion of mean search rTs in Epoch 1, per group.
Official websites use .gov
A
.gov website belongs to an official
government organization in the United States.
Secure .gov websites use HTTPS
A lock (
) or https:// means you've safely
connected to the .gov website. Share sensitive
information only on official, secure websites.
Time series analysis showing mean visual search response times (rTs) as a function of experiment and epoch in Experiment 2. The results are scaled to the proportion of mean search rTs in Epoch 1, per group.