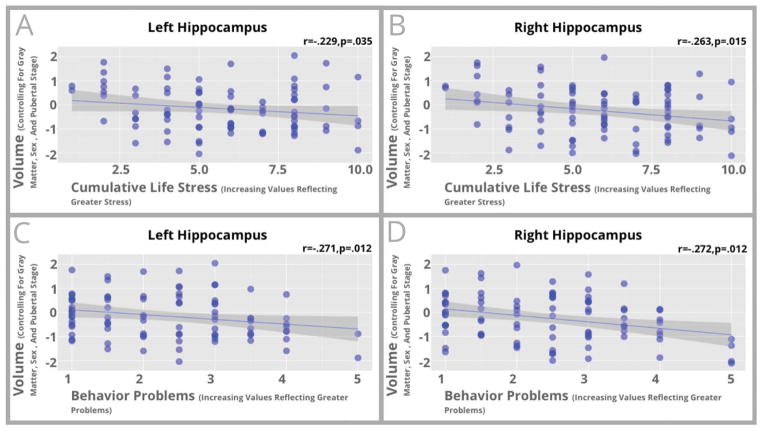
Figure 3.
Scatterplots between hippocampal volume and cumulative stress exposure (Left hippocampus shown in Panel A; Right hippocampus in Panel B) and behavioral problems (Left hippocampus shown in Panel C; Right hippocampus in Panel D) for participants who had suffered ELS are shown in this figure. Standardized residuals of hippocampal volume controlling for total gray matter, pubertal stage, and sex are shown on the vertical axis while cumulative stress exposure (Panels A and B) or behavioral problems (Panels C and D) is shown on the horizontal axis.

