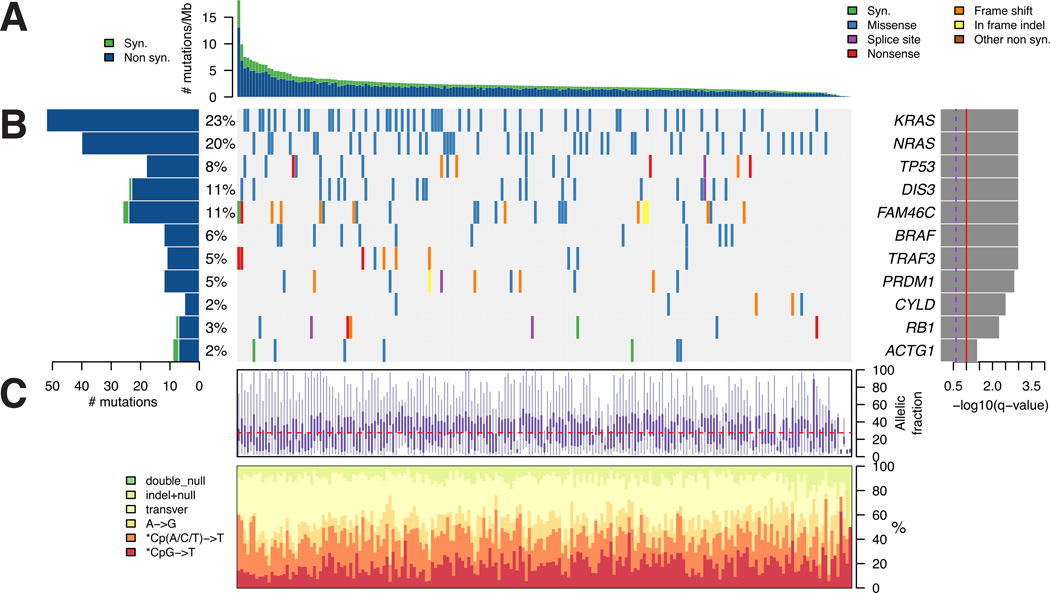
Figure 1. Determining significantly mutated genes in 203 patients with MM.
(A) The rate of synonymous and nonsynonymous mutations is displayed as mutations per megabase (of exome), with individual MM samples ranked by total number of mutations. (B) The heat map represents individual mutations in 203 patient samples, color-coded by type of mutation. Only one mutation per gene is shown if multiple mutations were found in a sample. Left: Histogram shows the number of mutations in each gene. Percentages represent the fraction of tumors with at least one mutation in the specified gene. Right: The 11 genes with the lowest q value (q-combined in Table S1), ranked by level of significance. (C) Base substitution and allelic fraction distribution of individual samples, ranked in the same order as in A. See also Figure S1 and Tables S1–S3.

