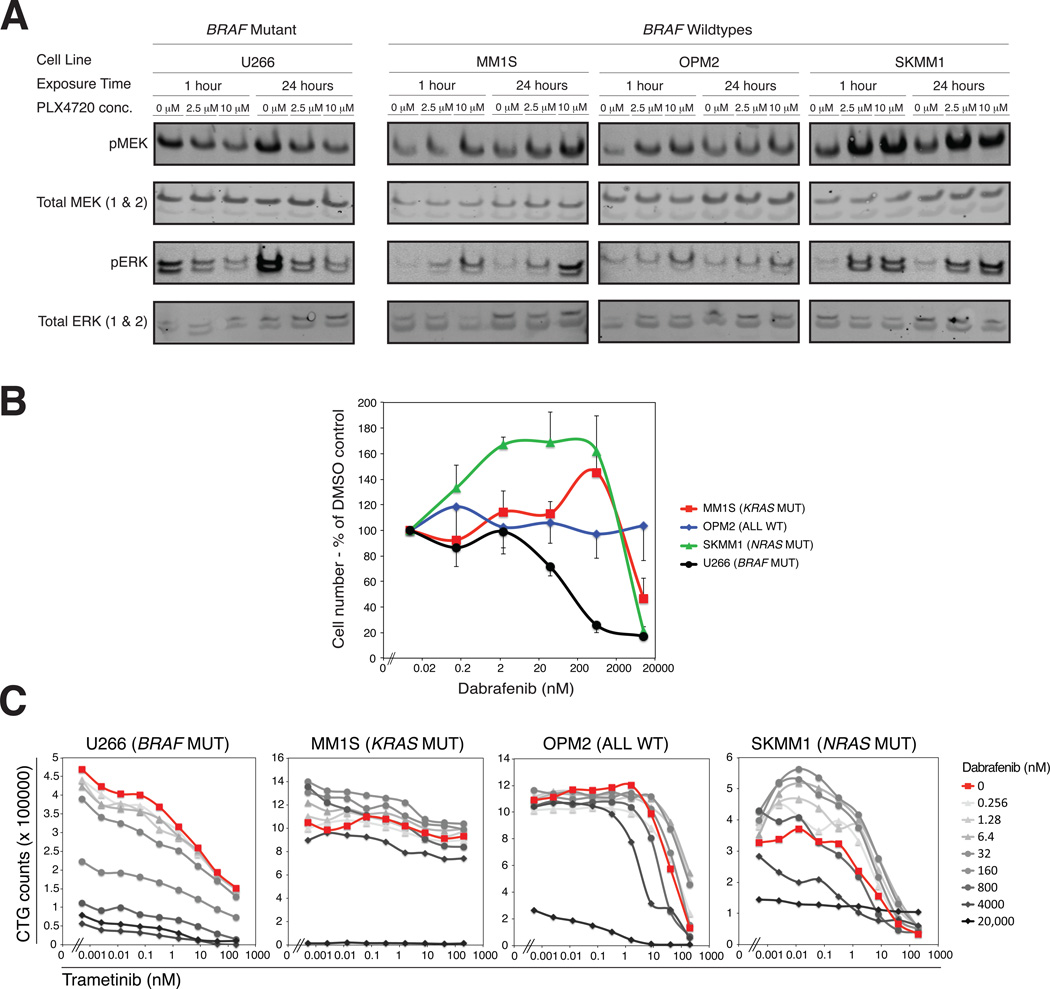
Figure 4. Heterogeneity composition determines the response to targeted therapy.
(A) The BRAF WT MM cell lines OPM2 (NRAS and KRAS WT, FGFR3 K650E), MM1S (KRAS G12A), SKMM1 (NRAS G12D) and the BRAF-mutant MM cell line U266 (BRAF K601N) were treated with the BRAF-inhibitor PLX4720 at the indicated concentrations. Phosphorylated and total MEK and ERK were detected by western blot at the indicated timepoints. (B) The indicated cell lines were cultured for 5 days in the absence or presence of increasing concentrations of the BRAF-inhibitor dabrafenib. Cell numbers were determined by flow cytometry on day 5 of culture and normalized to the cell number at a dabrafenib concentration of 0 µM (=100%). Error bars represent standard deviation. (C) The indicated MM cell lines were cultured in the presence of the MEK-inhibitor trametinib with or without dabrafenib at varying doses. The cell number on day 5 of culture was determined by cell titer glo. Curves with darker shades of grey represent higher concentrations of dabrafenib.

