
Figure 1.
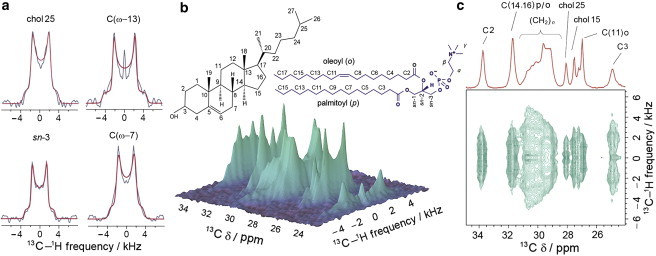
Site-specific 13C–1H RDCs are measured using a 2D DROSS spectrum for the case of the POPC/cholesterol (1:1) binary mixture at 30°C. (a) Selected recoupled powder patterns showing experimental (gray) and simulated (red) lineshapes. (b) Oblique view of the aliphatic fingerprint region of the DROSS spectrum of the binary system POPC/cholesterol. (c) A 2D plane of the spectrum shown in b. The 13C isotropic chemical shift (δ) spectrum is shown along F2 (the horizontal axis) (red). The peak separation of the Pake doublet yields the site-specific 13C-1H dipolar coupling along F1 (the vertical axis). Segmental |SCH| order parameter values are calculated as a function of peak position according to Eq. 2. To see this figure in color, go online.