
Figure 5.
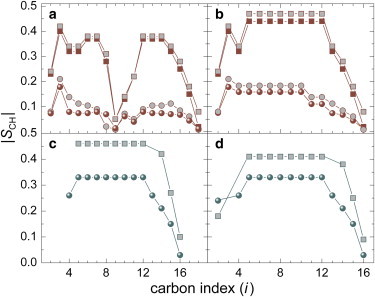
Segmental order parameter |SCH| profiles from SLF 13C NMR spectroscopy indicate a lipid-specific loss of conformational disorder due to cholesterol. Order profiles are plotted in terms of decreasing absolute magnitude for the sn-2 oleoyl chain of POPC (a), the sn-1 palmitoyl chain of POPC (b), the sn-2 sphingosine chain of EYSM (c), and the sn-1 palmitoyl chain of EYSM (d). Circles represent pure lipids and squares represent lipid mixtures with cholesterol (1:1). For POPC, data are shown at two temperatures, 28°C (gray-filled symbols) and 48°C (solid symbols), and for EYSM at 48°C. Note that upon adding cholesterol the |SCH| order parameters increase more in POPC than in EYSM. To see this figure in color, go online.