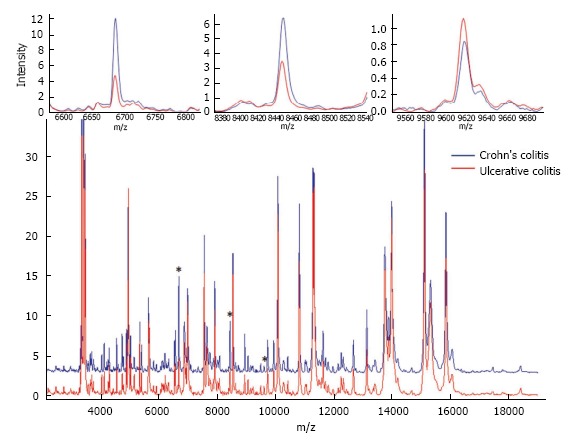
Figure 3.

Show averaged mass spectrum proteomic pattern spectra from Crohn’s colitis (blue) and ulcerative colitis (red). Differential distribution of three selected proteomic pattern peaks (m/z) obtained from colonic mucosal and/or submucosal tissue sections that were part of the Support Vector Machine model. They are denoted by “a” symbol in the full spectra. Reproduced with permission from the publisher: Seeley et al[50].
