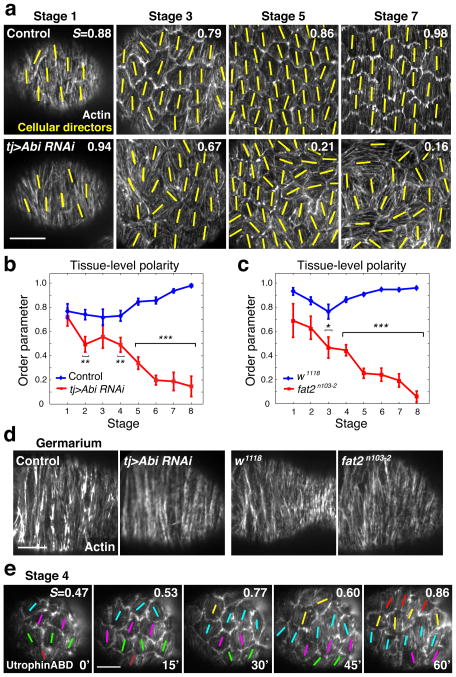
Figure 6.
Egg chamber rotation maintains the tissue-level alignment of the basal actin bundles. (a) Representative images of basal actin bundle alignment in control vs. AbiRNAi epithelia at different stages with the corresponding order parameter value (S). Yellow lines represent the mean orientation of the basal actin bundles in each cell. Spinning disk confocal images. (b) Graph showing the average order parameters for control (blue line) vs. AbiRNAi (red line) epithelia at stages one through eight. For stages 1–6 n ≥ 8, stage 7 n ≥ 5, and stage 8 n ≥ 4 (exact n values are in Supplementary Table 2). Data points represent mean ± SEM, t-test: **P < 0.003, ***P < 1.95×10⁻⁷. A t-test compares the difference between control and AbiRNAi epithelia at each stage. (c) Graph showing the average order parameters for wild-type (blue) vs. fat2n103-2 (red) epithelia at stages one through eight. For stage 1 n ≥ 4, 2–5 n ≥ 7, 6 n ≥ 5, 7 n ≥ 8, 8 n ≥ 4 (exact n values are in Supplementary Table 2). Data points represent mean ± SEM, t-test: *P = 0.012, ***P < 5.96×10⁻⁷. A t-test compares the difference between wild-type and fat2n103-2 epithelia at each stage. (d) Basal actin bundles within the germarium are globally aligned in control, AbiRNAi, wild-type and fat2 conditions. Spinning disk confocal images. (e) Stills from a sixty-minute near TIRF time series showing the basal actin bundles in a stage four egg chamber. The actin binding domain of Utrophin fused to GFP marks F-actin. The order parameter fluctuates, but there is a trend toward global actin bundle alignment. The colored lines show the mean actin bundle orientation for each cell. Rows of cells sharing the same color can be followed through time to visualize the downward migration of the epithelium. Scale bars, 10 μm.

