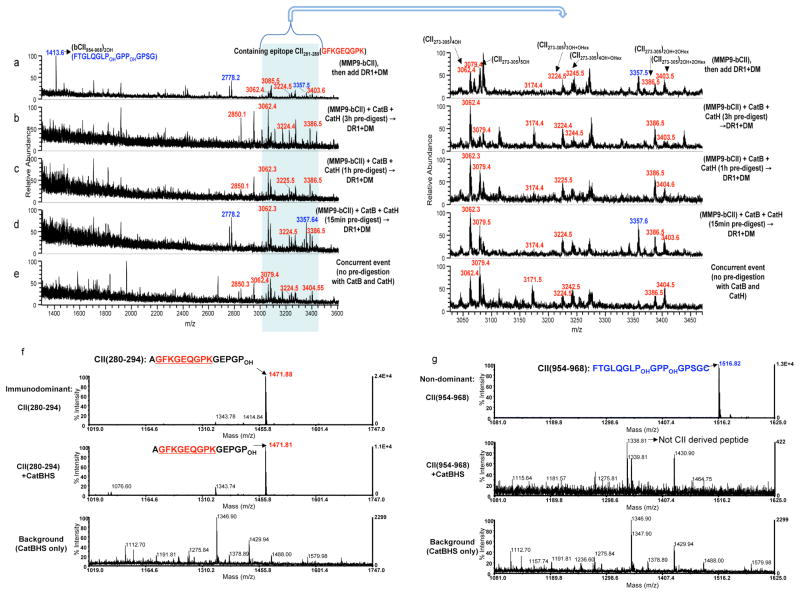
Figure 3. Type II collagen-derived immunodominant peptides are resistant to cathepsin digestion.
(a–e) Mass spectra of peptides eluted from DR1 are shown for m/z range of 1400–3600Da. (a) MMP9-bCII was incubated with DR1 and DM for 3h. (b) MMP9-bCII was first exposed to cathepsins B and H for 3h, (c) for 1h or (d) for 15min, and then incubated with DR1 and DM for additional 3h. (e) Mass spectrum of peptides eluted from DR1 when all components of the cell-free assay were mixed simultaneously and incubated together for 3h. As in Fig 1, the peaks in the shaded area between 3000–3550Da represent PTM variants of the dominant peptide bCII(273–305). Immunodominant peptides are labeled in red and non-dominant CII peptides are shown in blue. CII protein pre-digestion assays were repeated three times. (f) Mass spectra of synthetic CII(280–294) immunodominant peptide, and (g) Mass spectra of synthetic non-dominant CII(954–968) that were directly exposed to the cathepsins, B, H, and S for 1h at 37°C. Top spectra in both f and g show synthetic peptides without treatment. Middle spectra show samples incubated with the cathepsins. Bottom spectra correspond to the background samples containing only cathepsins. The peak at m/z 1338Da of the middle spectrum in (g) is not derived from the collagen CII(954–968) there is a background peptide from cathepsins. These experiments were repeated three times.

