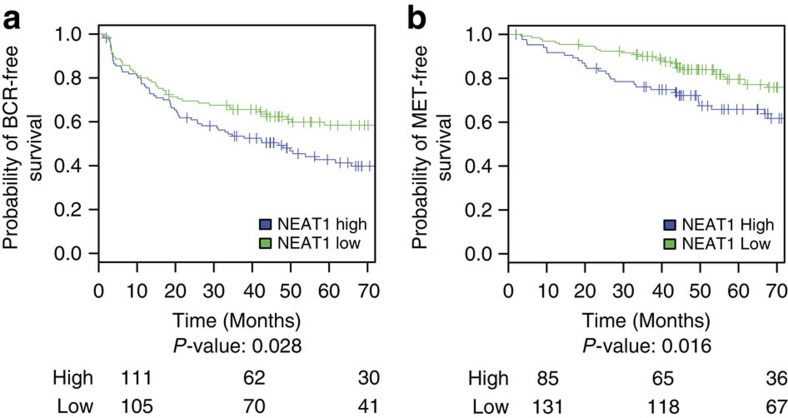
Figure 8. NEAT1 overexpression is associated with aggressive prostate cancer.
(a,b) KM curves showing (a) BCR-free survival and (b) MET-free survival for NEAT1 low and high expression groups of samples from the Mayo case–cohort data set35 (n=216). The cut points to define high and low NEAT1 expression were selected using patients from the Mayo nested case–control data set (n=378)58 by maximizing the product of the sensitivity and specificity for each endpoint. The number of patients at risk for each group is shown beneath the plot.

