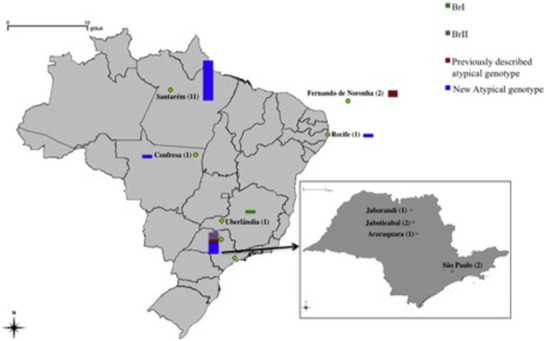
Fig. 2.

Geographical distribution of the genotypes of Toxoplasma gondii from wildlife in Brazil. Samples are grouped by states. Sample size is represented by the size of the bar and the number written in brackets. The smallest bar represents one genotype. Color code: green, purple, red and blue are for BrI, BrII, previously described atypical genotypes and new atypical genotypes, respectively.
