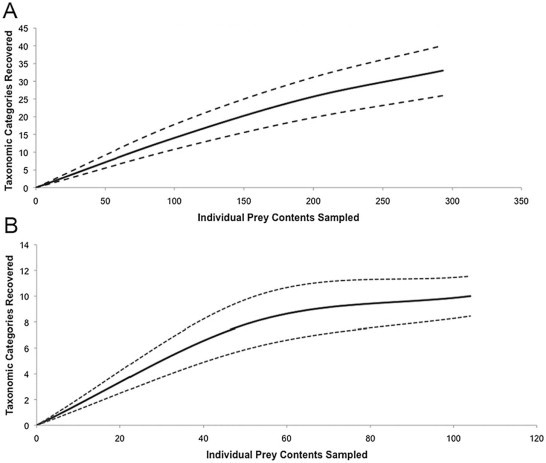
Fig. 3.

Prey content species richness accumulation curves based on 1000 randomizations using Estimate 9.1.0. Data obtained from stomach flushing or necropsy of American alligators from (A) coastal or (B) inland habitats between 2008 and 2011. The black broken line (- -) represents the upper 95% confidence level, and the broken dotted broken line (- ⋅ -) represents the lower 95% confidence level of the species accumulation curve. The slow approach to the asymptote in coastal habitats suggests prey contents of sampled alligators did not capture all probable prey. The asymptote of inland alligators slowly begins to plateau, which may suggest our sampling efforts were close to capturing most of the probable prey of alligators.
