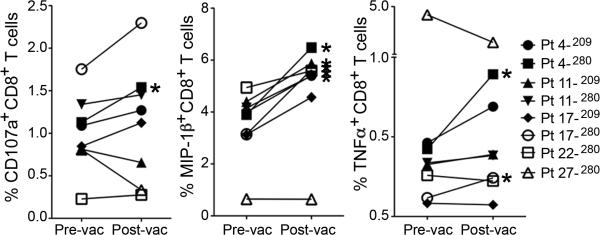
Figure 6. Polyfunctional intracellular cytokine changes following mouse gp100 DNA vaccination.

This figure shows the mean values of CD107a+, MIP-1β+, and TNF-α+ cells within the CD8+ T cell population before and after vaccination for all time points when the patient produced significant IFN-γ+CD8+ T cells. Positive time points are marked by asterisks.
