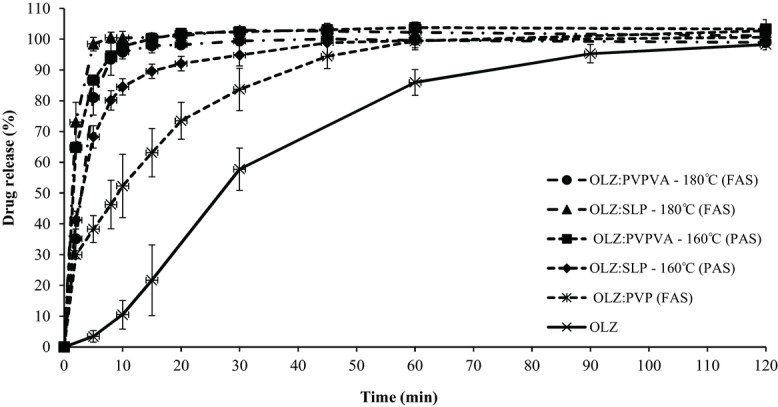
Figure 9.

Dissolution profiles of pure OLZ and HME formulations with PVP, PVPVA, and SLP with 50% drug loading extruded at 160°C and 180°C (FAS, fully amorphous systems; PAS, partially amorphous systems). The legend on the right hand side follows the same order as the curves in the plot (top to bottom).
