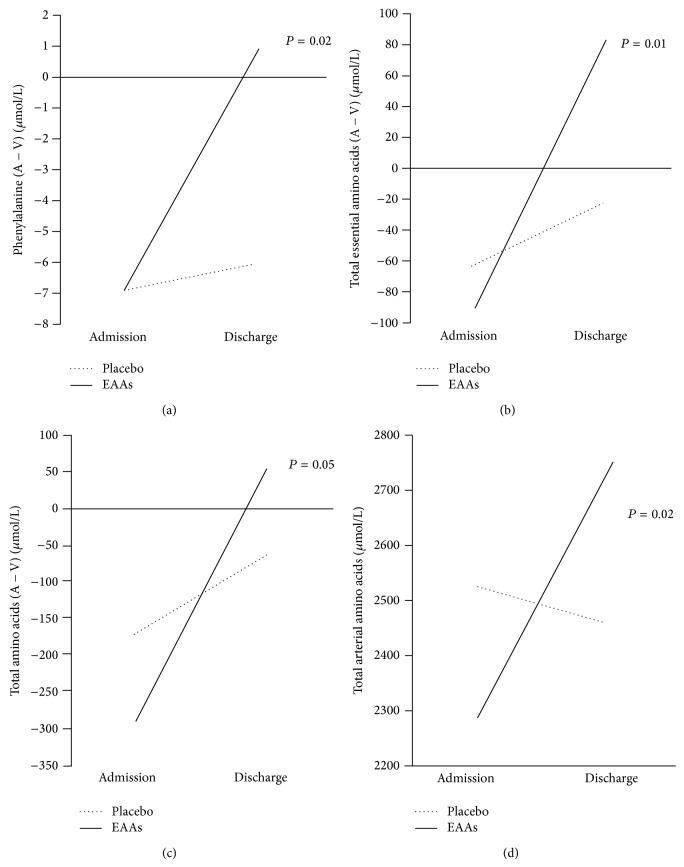
Figure 2.
Time courses of phenyl-, total essential amino acid, total amino acid (A − V) differences, and total arterial amino acid levels of stroke population. The point 0 indicates no uptake/no release. For clarity, standard deviations are omitted (see Table 4).

