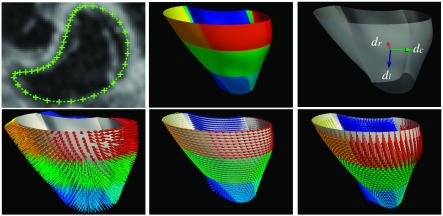
FIG. 4.

The cardiac coordinate system in our experiments. The left top figure shows the endocardium contour. The mid top figure shows the 12 endocardium segments in colors. The top right figure shows the radial (dr), circumferential (dc), and longitudinal (dl) directions in a vertex of the endocardium. The bottom row shows the dr, dc, and dl directions in all mesh vertices.
