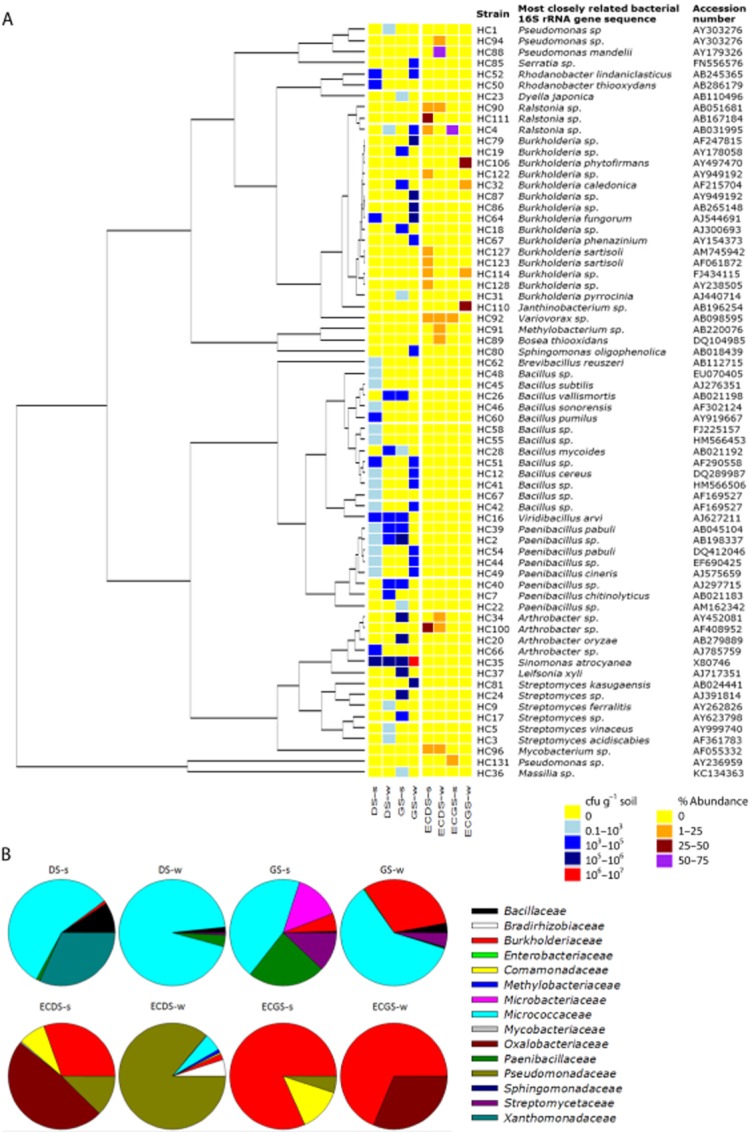
Fig. 1.

A. UPGMA tree and heat map showing the phylogenetic relationships and abundance of the isolated strains for each of the different soils. The identified species correspond to the 68 clusters of different 16S rRNA gene ARDRA profiles, grouped based on 99% nucleotide similarity of the 16S rRNA gene sequences. From left to right: the UPGMA phylogenetic tree constructed with Geneious using the 16S rRNA gene sequences, heat map showing the abundance of the species in cfu g−1 soil for DS and GS obtained on 1/10 rich medium (yellow: 0 cfu g−1; light blue: 0.1–103 cfu g-1, blue: 103–105 cfu g−1, dark blue: 105–106 cfu g−1 and red: 106–107 cfu g−1) and the relative abundances in % of the species in each soil after enrichment cultures (EC) of the soils in the colour codes (yellow: 0; orange: 1–25%; dark-red (25–75%) and purple (75–100%). The corresponding strain number is shown next to the heat map, the most closely related bacterial 16S rRNA gene sequence and Genbank accession number of the most closely related species. B. Pie diagrams showing the bacteria family distribution of the different soils (in percentage %) on 1/10 rich medium (DS-s,w; GS-s,w) and isolated after successive dilution cultures with 2,4-DNT [enrichment culture 2,4-DNT contaminated soil (ECDS)-s,w; ECGS-s,w]. Calculations were performed on the different 16S rRNA gene identified strains.
