FIGURE 2.
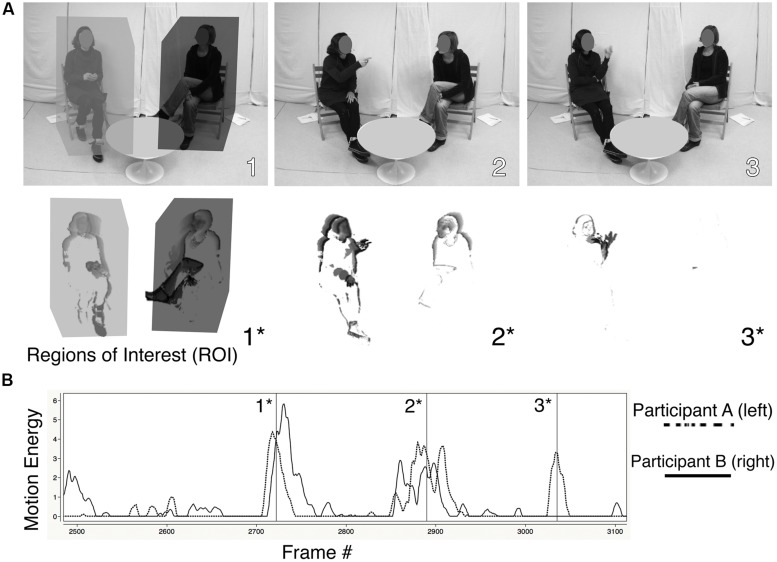
Motion energy analysis (MEA). (A; top row), consecutive frames 1, 2, and 3 of split-screen video recordings. (A; bottom row), corresponding images of motion energy 1*, 2*, and 3*. (B) time series of individual motion energies (ordinate: smoothed, z-standardized and threshold-adjusted motion energy values; abszissa: time in 1/10 s). The regions of interest (ROI) are shown as boxes in image 1 and 1*. In images 1* and 2*, episodes of nonverbal synchrony occur.

