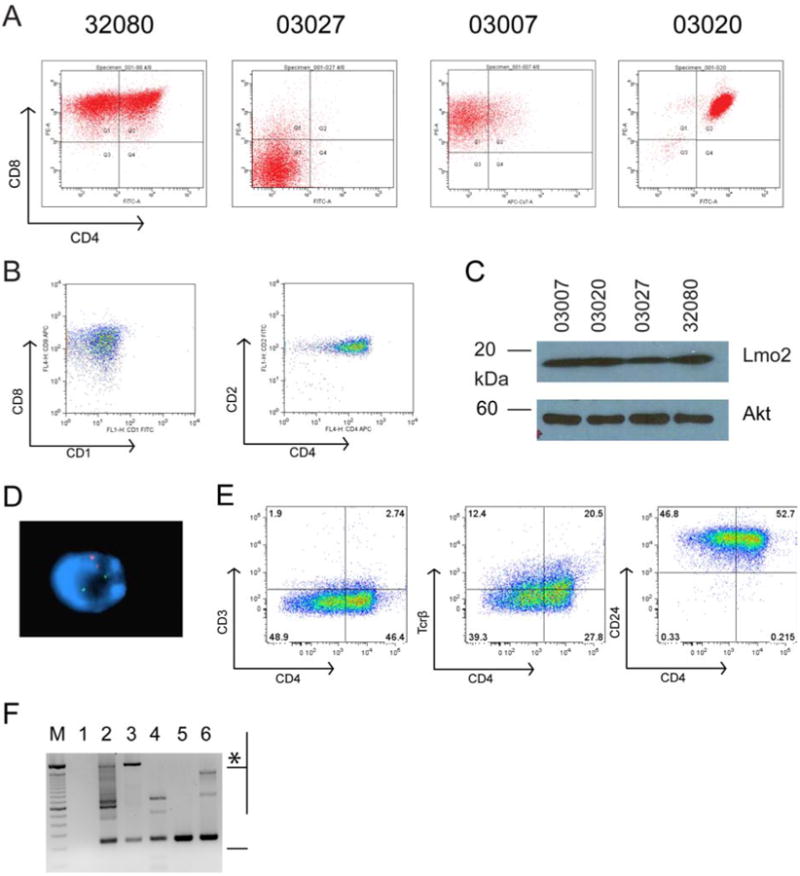
Figure 1. Lmo2 induces T-cell leukemia with diverse patterns of CD4 and CD8 expression and variegation in CD4.

Single cell suspensions of T-ALLs from CD2-Lmo2 transgenic mice were cultured in vitro and single cell cloned by two rounds of limiting dilution. A, shows FACS analysis of CD4 and CD8 antigen expression on cell lines 32080, 03027, 03007, and 03020. B, shows FACS plot of a human T-ALL sample that overexpresses LMO2. Left panel shows analysis of CD8 and CD1 and right panel shows CD2 and CD4. C, shows SDS-PAGE followed by Western blot analysis for Lmo2 protein and Akt protein as a loading control for the murine cell lines shown in A with equivalent protein from whole cell lysates loaded. D, shows a representative 32080 interphase cell analyzed by FISH for the murine CD4 gene (red) and the CD2-Lmo2 transgene (green). E, FACS plots of 32080 cells stained for CD4 and CD3, Tcrβ, and CD24 (HSA). F, agarose gel of PCR products on genomic DNA from the cell lines using primers flanking Dβ and Jβ2. M designates a 100 bp marker; top intense band is 2 kb. Lane 1, H2O; lane 2, thymic genomic DNA from WT B6 mouse; lane 3, tail genomic DNA showing the 2 kb germline band (asterisk) with some rearranged Jβ2 probably from blood contamination; lane 4, line 03007; lane 5, line 03020; and lane 6, line 32080. Bracket designates products with rearranged Jβ2.
