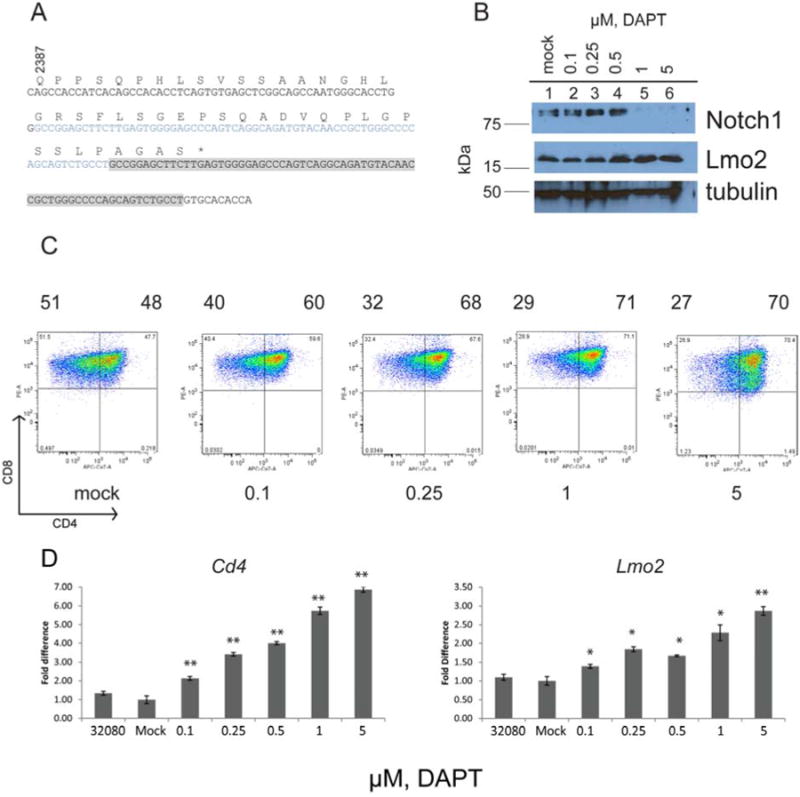
Figure 5. 32080 cells have constitutive intracellular Notch1 protein that can be inhibited by gamma secretase inhibition and increase CD4 expression.

A, exon 34 of Notch1 cDNA was cloned from 32080 cells; wild type sequence is shown in black. Sequence in blue and gray shows a 68 base pair region that was duplicated inducing 4 new residues (AGAS) followed by a premature stop codon (shown at asterisk). B, Western blot analysis of 32080 cells treated with increasing concentrations of DAPT (in μM). Top panel shows blot with anti-Val1744 of Notch1, followed by anti-Lmo2, followed by anti-tubulin as loading control. C, shows FACS plots of CD4 and CD8 expression of 32080 cells treated with increasing concentrations of DAPT. Numbers under the histograms show DAPT concentration in μM. Numbers above the histograms show the percentage of cells in CD4- and CD4+ quadrants. D, graph shows qRT-PCR for CD4 mRNA in the left panel and Lmo2 mRNA in the right panel. Bars represent the mean of triplicate values with SEM. Statistical comparisons were made between the mock treated cells by unpaired t-test. The double asterisks denote P<.001; single asterisks denote P<.006. The graphs represent three independent experiments.
