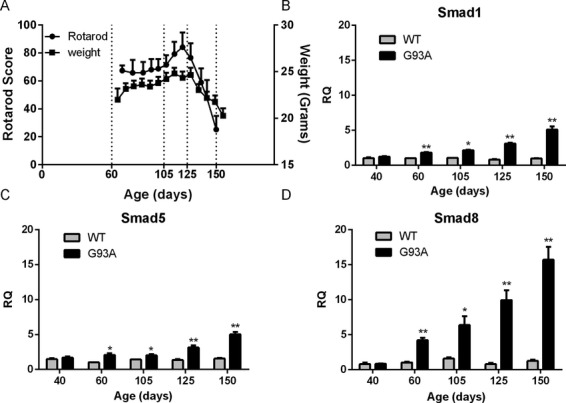
Figure 2.

Smad1, 5, and 8 mRNAs are upregulated in G93A SOD1 mouse muscle and increase with disease progression. (A) Rotarod testing and weight measurement of G93A SOD1 mice over the course of the disease. Gastrocnemius muscle samples were obtained at the ages shown and also at day 40. Control muscle samples were obtained from age-matched nontransgenic littermates. (B) Smad1, (C) Smad5, (D) Smad8 mRNA levels were quantitated using qRT-PCR and normalized to an internal housekeeping (GAPDH) control. All data points represent the mean ± SEM of 3–8 independent mice. *P < 0.01; **P < 0.001.
