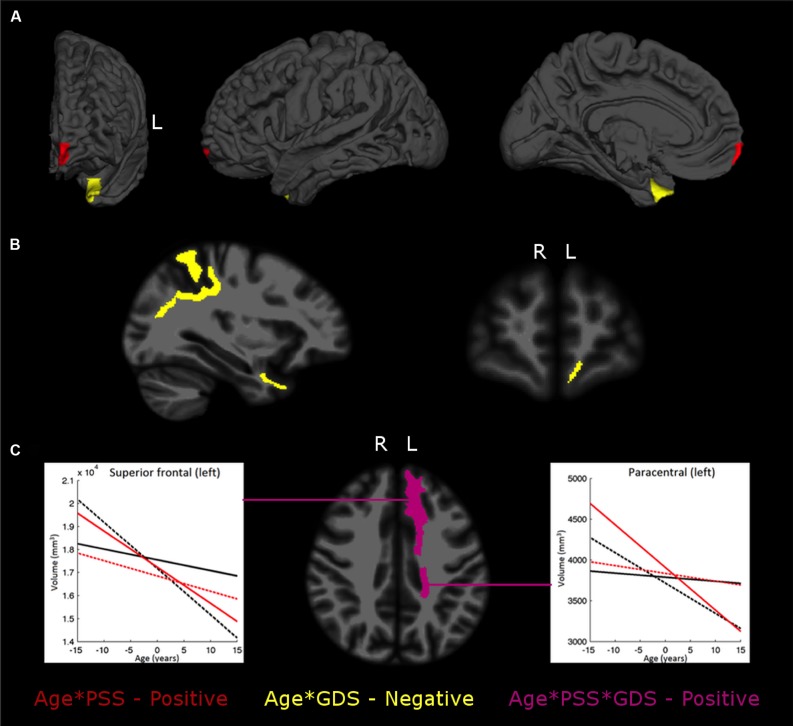
FIGURE 1.
The interplay between stress or mood and aging in brain regional gray matter (GM) volumes (A), white matter (WM) regions (B), and the Age*PSS*GDS interactions (C). The images depict areas with significant interaction effects of age*PSS positive (in red), age*GDS negative (in yellow) and age*PSS*GDS positive (in violet). In (C) each graphic line is the regression line between age and regional volume for: Low PSS values (LPSS, black lines), combined with Low GDS (LPSS–LGDS, solid line), or with High GDS (LPSS–HGDS, dotted line); and High PSS value (HPSS, red lines), combined with Low GDS (HPSS–LGDS, solid line) or High GDS (HPSS–HGDS, dotted line).

