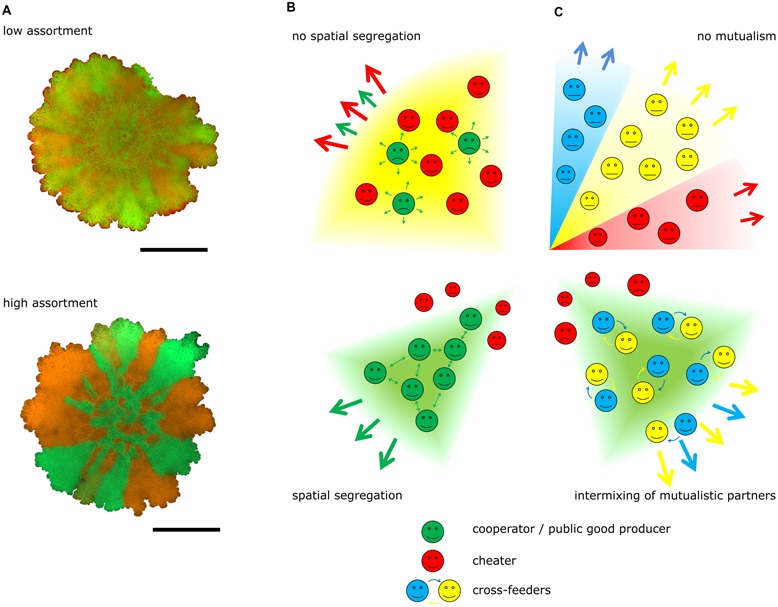
FIGURE 1.

Cooperation and spatial distribution. (A) Experimental examples of Bacillus subtilis colony biofilms are shown with low (above) and high (below) spatial assortment of genetically identical strains with different fluorescent labels. Strains producing green- or red-fluorescence proteins were mixed and used to initiate colony biofilms as described by van Gestel et al. (2014). Pictures were obtained with AxioZoom V16 microscope (Zeiss). Scale bars indicate 5 mm. (B) Schematic figures depict the role of spatial segregation on the stability of cooperation: non-producers exploit the public good produced by cooperators if no spatial segregation exists in the expanding population (above), while cooperative traits are sustained under high spatial segregation (below). (C) Spatial segregation during competition (above) is suppressed when microbial strains or species are exchanged in a mutualistic interaction (below), which results intermixing of partners. Green and red symbols indicate public good producers and non-producers, respectively, while blue and yellow symbols denote mutualistic cross-feeders. Thick arrows show colony expansion, whereas thin arrows designate public (B) or exchanged (C) goods.
