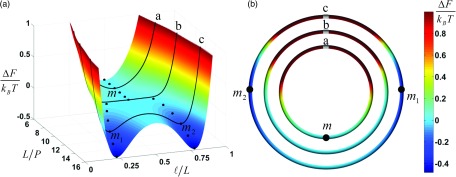
FIG. 8.

Free-energy landscape ΔF(ℓ, L; P) of a dual-loop DNA synaptic complex. (a) ΔF as a function of contour to persistence length ratio, L/P, and fractional contour length ℓ/L (cf. Fig. 2). At a critical value L/P ≈ 10.7, the minimum for ΔF (black dots) bifurcates from a single minimum at m = L/2 into two separate minima at m1 < L/2 and m2 = (L − m1) > L/2, respectively. Black curves labeled a, b, c represent free energy profiles for fixed ratio L/P. (b) ΔF along a circular DNA molecule with fixed ratio L/P, corresponding to curves a, b, c in (a), as a function of the separation ℓ (to scale). One of the synapse sites is located at the top of each circle. Values of ΔF are represented by colors as shown. Chain a: L/P = 8 (about 1200 base pairs), with a single minimum m; chain b: critical value L/P ≈ 10.7 (about 1600 base pairs); chain c: L/P = 14 (about 2100 base pairs), with two separate minima m1 and m2.
