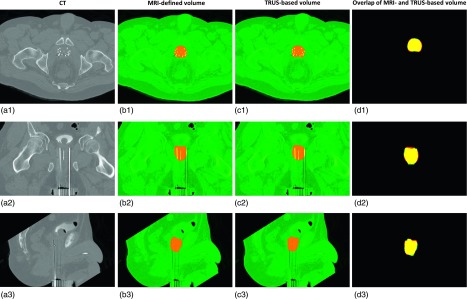
FIG. 8.

Comparison of the TRUS-based prostate segmentation and MR-defined prostate volume. (a1)–(a3) are the axial, coronal, and sagittal CT images; (b1)–(b3) are the CT images with MRI-defined prostate volume; (c1)–(c3) are the CT images with our TRUS-based segmented prostate volume; (d1)–(d3) are the volume overlap between our TRUS-based segmented prostate volume and MRI-based prostate volume.
