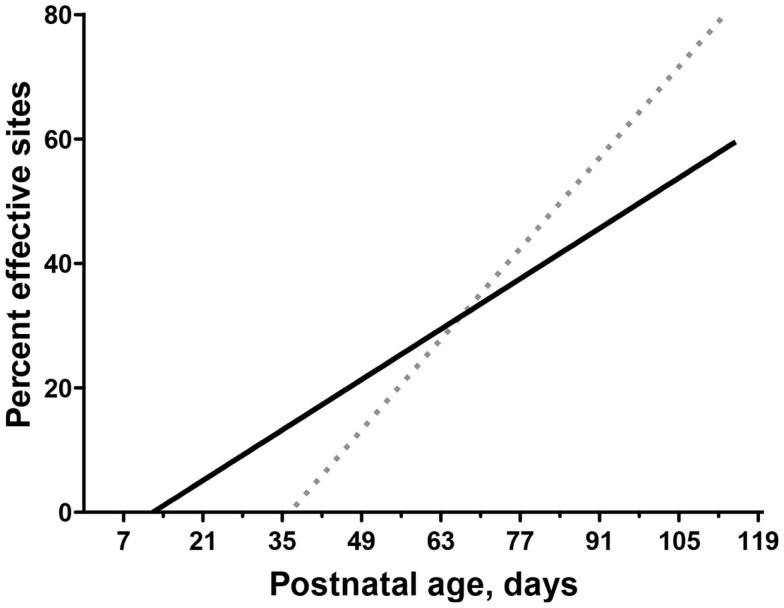
Figure 4.
Differential motor map development in motor cortex and red nucleus. Modified from Williams et al. (32) and Chakrabarty and Martin (35). Comparison of age-dependent increases in the percentage of sites in motor cortex (dotted line) and RN (solid line) where stimulation produced a contralateral motor response (termed effective sites). The linear fit is shown for both motor cortex (Y = 1.54x − 68.62) and RN (Y = 0.66x − 10.03).

