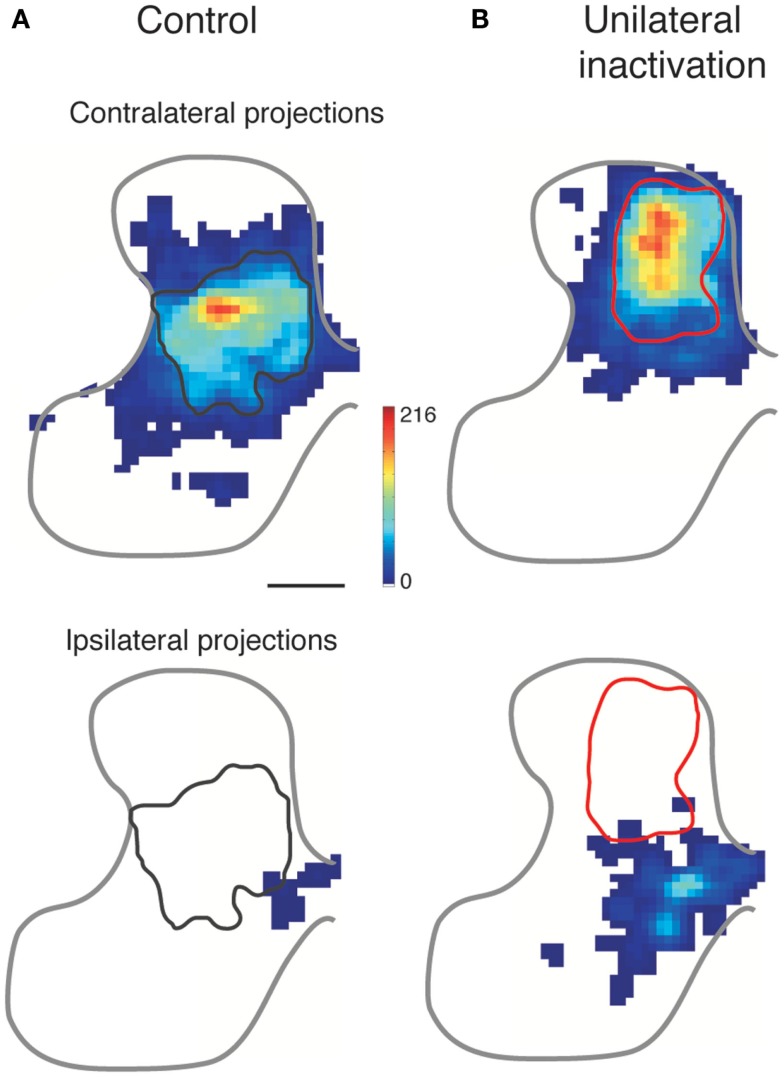
Figure 5.
Effect of activity blockade on CST development. Modified from Friel and Martin (24). Color-coded representations show local CST density in the cervical gray matter. The normal contralateral CST projection (A) is densest to the intermediate gray matter, and does not overlap with the ipsilateral projection from the other hemisphere, which is located medially. After perinatal inactivation (B), the contralateral projection shifts dorsally and the ipsilateral projection from the other hemisphere expands laterally. The gray and red outlines mark the densest territory of contralateral CST projections for normal development (left column) and after unilateral CST inactivation (right column), respectively. The contralateral and ipsilateral “heat maps” are plotted with the same color scales.

