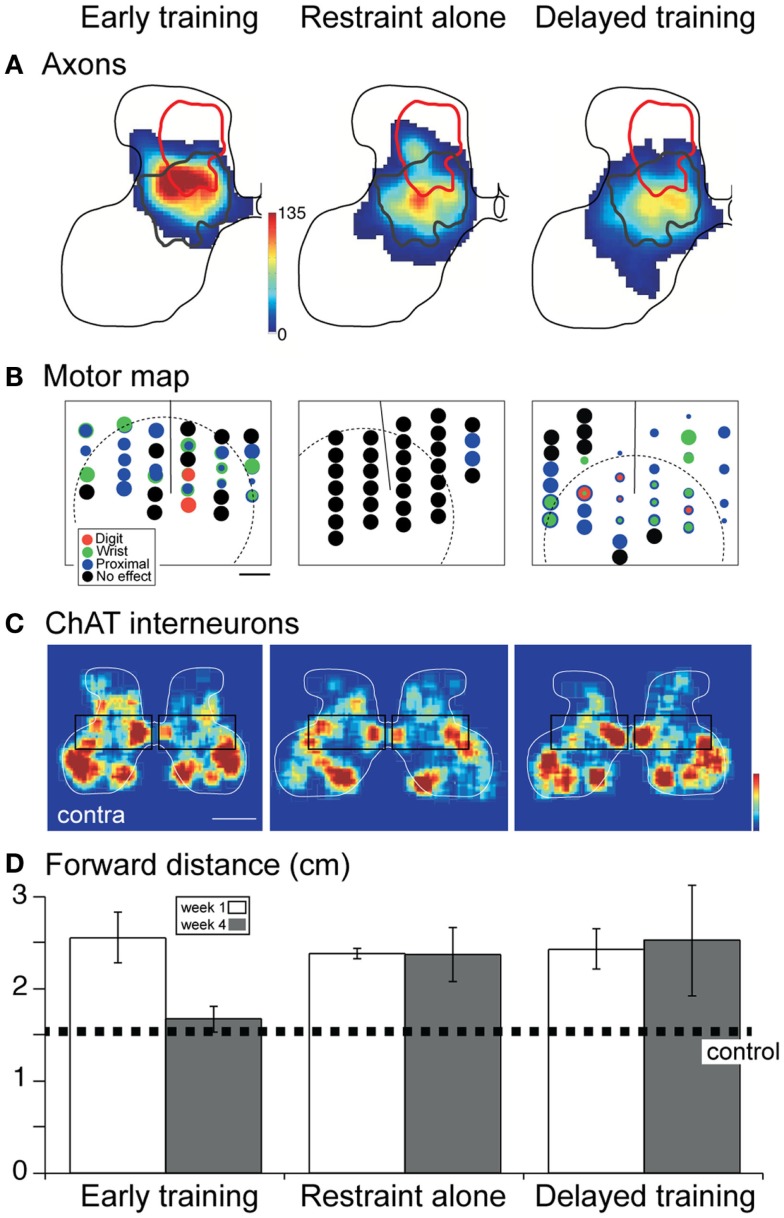
Figure 7.
Effect of constraint of the unimpaired limb on CST projections, the motor cortex motor map, spinal cholinergic interneurons, and skilled behavior. Modified from Friel et al. (41). (A) Distribution of CST projections in the cervical enlargement. Density of projections is represented by a color scale, with red corresponding to the densest projections. All “heat maps” are plotted with the same color scale. The red line corresponds to the aberrant dorsal projection of the inactivated CST (as shown in Figure 6), whereas the dark gray line is the normal distribution (Figure 6). (B) Motor cortex motor map. Each site examined for a motor response with stimulation is marked by a circle. The threshold for evoking a contralateral motor response is represented inversely by circle diameter. Black corresponds to no response sites. (C) Color-coded representations of local cholinergic interneuron density. Boxes highlight differences in relative density. Contralateral compared with ipsilateral density is greatest for early training. (D) Forward distance is a measure of reaching accuracy. The dotted line marks normal performance. Over-reaching is characteristic at 1 week for all groups. Only the early trained group shows recovery to normal distances; performance of the other groups remains errant.

