
Fig 1. Combination of IL2 and anti-TGFβ significantly increases NK cell population, improves NK function in mice and promotes NK cell maturation.
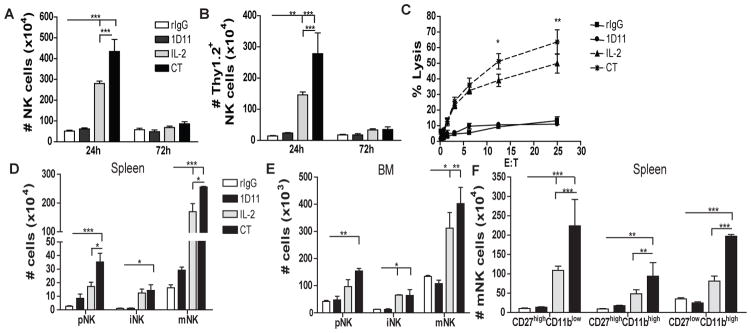
24h or 72h after the end of treatment spleen or BM of C57BL/6 mice were collected and single cell suspensions were stained for NK cell phenotypic analysis by flow cytometry. (A) Total number of NK cells (CD45+CD3−NK1.1+) is shown for mice treated with rIgG/PBS (white bars), 1D11 (dark gray bars), LD IL2 (IL2: light gray bars) or combination of both (CT: black bars). (B) Total number of Thy1.2+ NK cells. (C) Percentage of tumor lysis of purified NK cells cultured at different effector:target (E:T) ratios was assessed. (D–E) Total number of cells that are precursor NK (pNK:CD3−CD122+NKG2D+NK1.1−DX5−), immature NK (iNK:CD3−CD122+NKG2D+NK1.1+DX5−) and mature NK (mNK:CD3−CD122+NKG2D+NK1.1+DX5+) cells for spleen and BM at 24h. (C) Distribution of CD27 and CD11b at 24h from spleen is shown. Data are representative of two or three experiments with 3 mice per group (mean ± SEM). One-Way Anova or Two-Way Anova was used to assess significance. Significant differences are displayed for comparisons with rIgG control group as well as between IL2 and CT groups (*p<0.05, **p<0.01, ***p<0.001).