
Fig 2. IL2 and TGFβ blockade results in T cell expansion with improved CD8 T cell function.
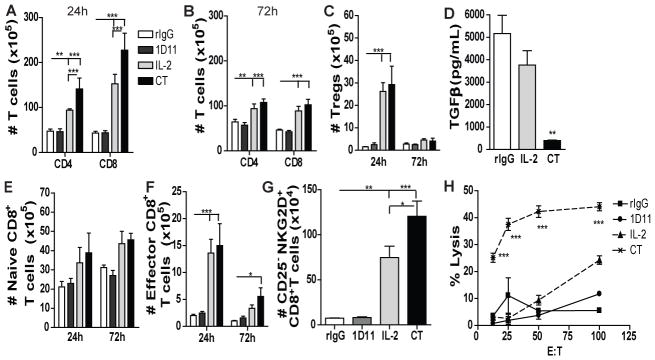
Single cell suspension from spleen were stained for CD45, CD3, CD8, CD4, CD44, CD62L or CD45, CD3, CD4, CD25 and Foxp3 to determine the distribution of CD4 T cell, CD8 T cell and Tregs. (A–C) Total number of CD4 T cells (CD45+CD3+CD4+), CD8 T cells (CD45+CD3+CD8+) and Tregs (CD45+CD3+CD4+CD25+Foxp3+) at 24h and 72h. (D) TGFβ Levels in the serum of treated mice at 24h. (E–F) Total number of naïve CD8 T cells (CD45+CD3+CD8+CD44−CD62L−) and effector CD8 T cells (CD45+CD3+CD8+CD44+CD62L−) at 24h and 72h. (G) Total number of bystander memory-activated CD8 T cells (CD45+CD3+CD8+CD44+CD25−NKG2D+) at 24h. ((H) CD8 T cell-specific lysis of P815 tumor cells from splenocytes of treated mice assessed by redirected killing assay. Data are representative of 3 independent experiments with 3 mice per group (mean ± SEM). One-Way Anova or Two-Way Anova was used to assess significance. Significant differences are displayed for comparisons with rIgG control group as well as between IL2 and CT groups (*p<0.05, **p<0.01, ***p<0.001).