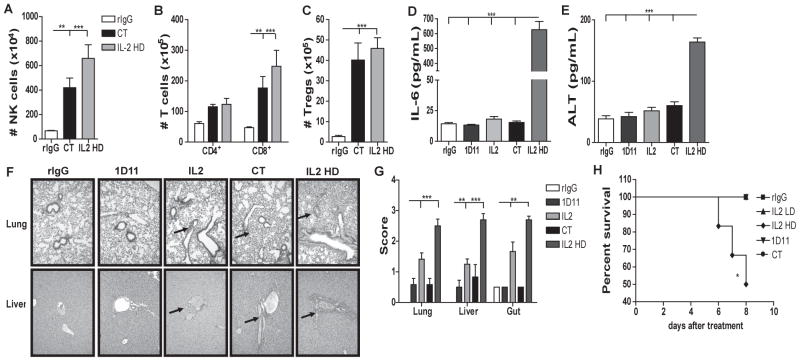
Fig 3. Combination therapy results in similar expansion of NK and T cells without induction of toxicity observed in HD IL2-treated mice.
(A–C) Total number of NK, CD4, CD8 T cells and Tregs in the spleen at 24h post-treatment. rIgG (white bars), CT (LD IL2 + 1D11) (black bars) or IL2 HD (1 million IU) (gray bars). (D–E) Serum IL6 and alanine transaminase (ALT) levels at 24h. (F) Representative images of histopathology slides of liver and lungs. (G) Scoring of H&E histology slides of livers, gut, and lungs at 24h. (H) Percentage of survival during treatment. Black arrows indicate periportal lymphocytic aggregates that are more significant in HD IL2 treated mice. Data is representative of at least two independent experiments with 3 mice per group (mean ± SEM). One-Way Anova or logrank test (H) was used to assess significance. Significant differences are displayed for comparisons with rIgG control group. (*p<0.05, **p<0.01, ***p<0.001).

