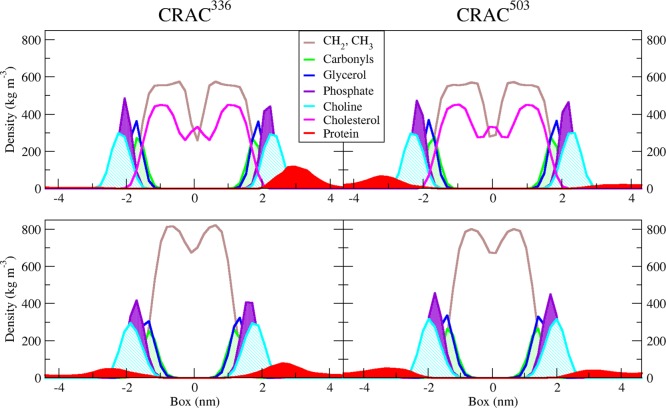
Figure 1.
Density profiles of each CRAC peptide/membrane system along the membrane normal. CRAC336 and CRAC503 systems are in the left and right columns, respectively, and density profiles near the 60:40 DMPC/CHO and pure DMPC bilayer are represented in the top and bottom rows, respectively. Peptide density is shown in red; cholesterol density is magenta, and DMPC densities are broken into hydrocarbon, carbonyl, glycerol, phosphate, and choline groups (see legend for color definitions).

