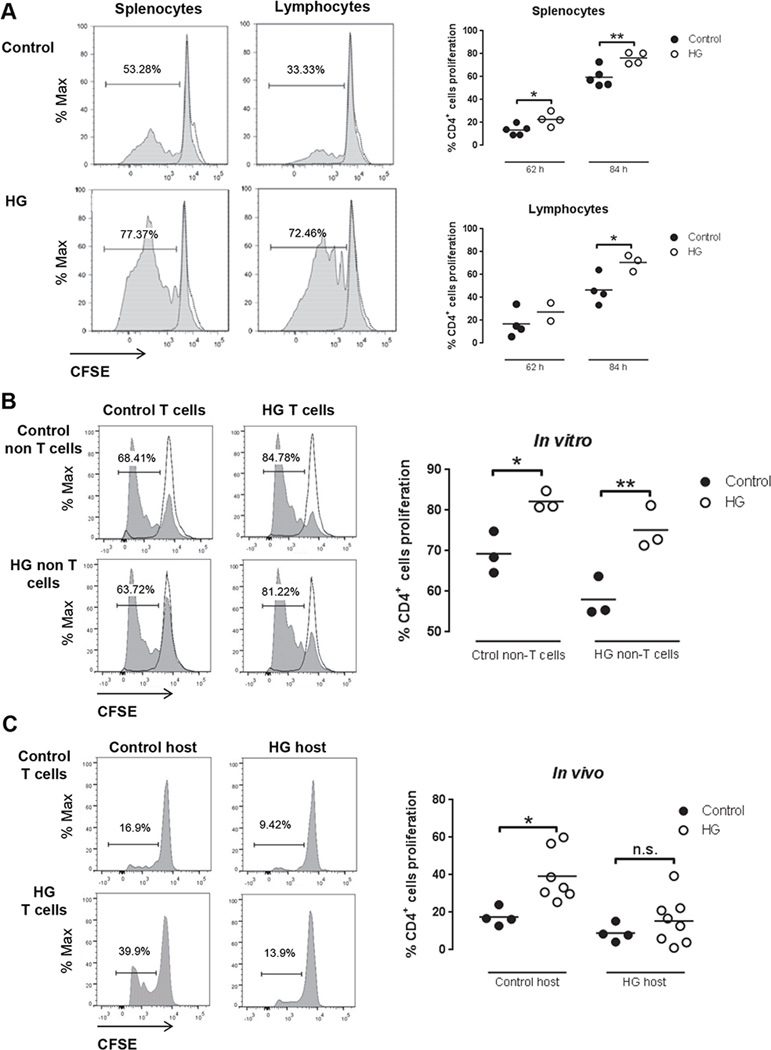
Figure 2. In vitro and in vivo T cell proliferation in OT-II control and HG mice recognizing OVA.
A, Representative histograms (left) of CD4+ splenocytes and lymphocytes proliferation from control or HG mice stimulated with 100 µg/ml OVA in vitro for84 h. Percentage of CD4+ T cells proliferation from splenocytes (n=4–5) or lymphocytes (n=2–4) in control or HG mice stimulated with 100 µg/ml OVA in vitro for62 h and 84 h (right graphs). Proliferation of CD4+ T cells was detected by flow cytometry and CFSE dilution. B, Splenocytes depleted of T cells by negative selection with magnetic beads (non-T cells) from control or HG mice were used as APC. T cells from euglycemic OT-II mice or HG OT-II mice were isolated by negative selection by magnetic beads and labeled with CFSE. Purity of T cells was >75% and of non-T cells >97% after isolation. In vitro cultures of 30% T cells and 70% non-T cells were stimulated with 100 µg/ml OVA in vitro for 87 h (n=3). Proliferation of CD4+ T cells was detected by flow cytometry and CFSE dilution. Two-way ANOVA showed no statistically significant interaction between the source of T cells and of APC. C, Pooled splenocytes and lymphocytes from euglycemic OT-II mice (n=4) or HG OT-II mice (n=7–8) were labeled with CFSE and adoptively transferred to euglycemic control or HG mice. Beta-glucan particles loaded with OVA were delivered to the lungs by tracheal instillation followed by harvest of the thoracic lymph node 62 h later. Lymphocytes were isolated and proliferation of CD4+ T cells was detected by flow cytometry and CFSE dilution. All experiments were repeated at least twice. Statistical differences were analyzed by Student’s t test and two-way ANOVA followed by Bonferroni’s post analysis test, *p<0.05, **p<0.01.

