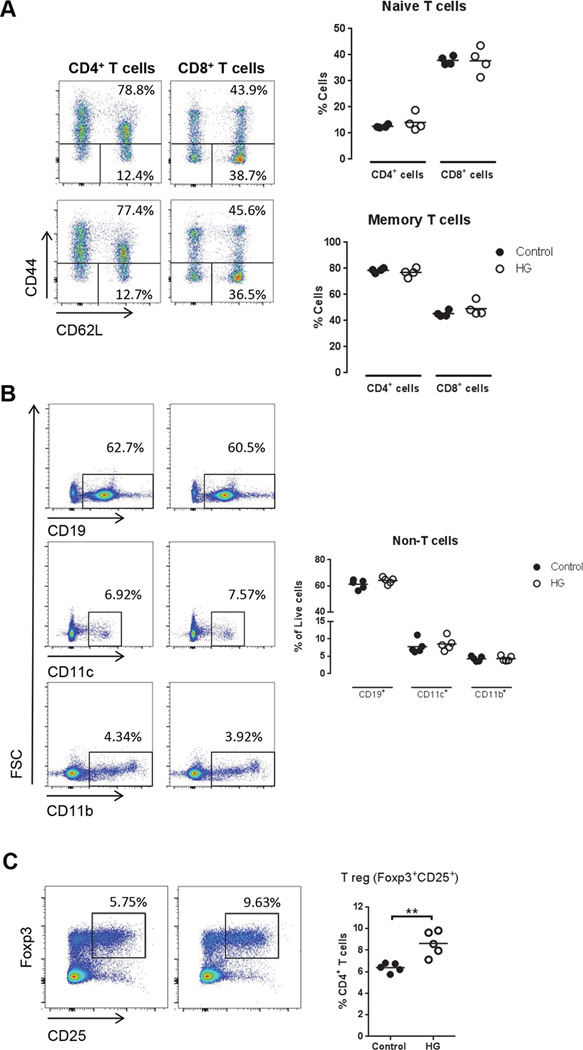
Figure 3. Characterization of CD4+ and CD8+ T cells and APC phenotype and regulatory T cells in control and HG mice.
Splenocytes and lymphocytes were isolated from control or HG mice and stained for flow cytometry for the markers CD4, CD8, CD44, CD62L, CD19, CD11b, CD11c, CD25 and Foxp3. A, Percentage of naïve T cells, CD44−CD62Lhigh, and memory T cells, CD44+ (n=4). B, Percentage of other cell populations in spleen and lymph nodes (n=5). C, Percentage of regulatory T cells (CD4+CD25+Foxp3+). All experiments were repeated at least three times. Statistical differences were analyzed by Student’s t test.

