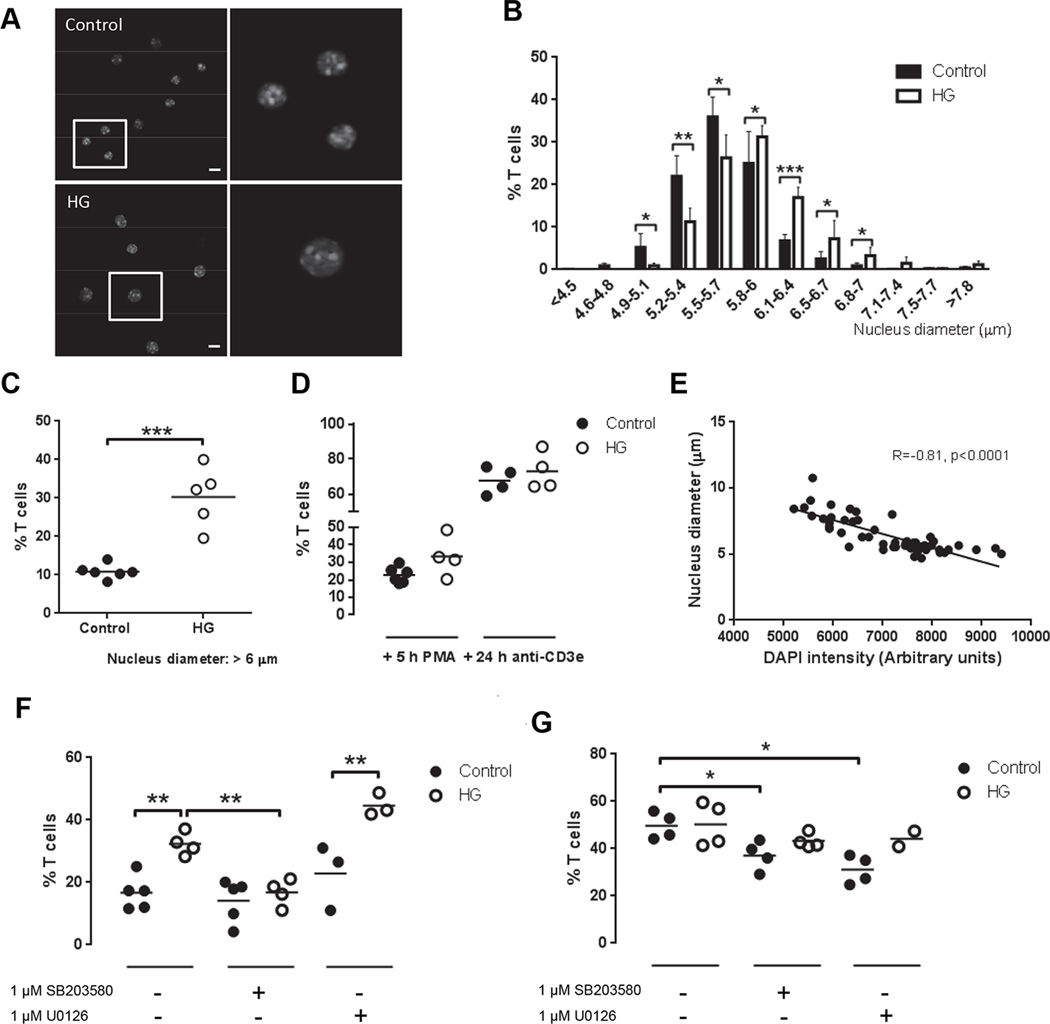
Figure 5. Chromatin decondensation in T cells from control and HG mice.
T cells from control or HG mice were isolated by negative selection with magnetic beads. CD25+ cells were depleted by magnetic beads and the remaining cells were DAPI stained. T cell purity was analyzed by flow cytometry staining and >90% of the cells were CD4+ or CD8+ and CD25−. The diameter of the nucleus was measured in individual cells by fluorescence microscopy. A, Representative images of T cells stained with DAPI from control and HG mice, scale bar indicates 10 µm. B, Nucleus diameter measurements grouped by size in the indicated bins, expressed as the % of all T cells, mean ± SD (n=5–6). C, Percentage of T cells with nuclei >6 µm in diameter (n=5–6). D, Percentage of T cells stimulated or not with 40 nM PMA or plate-bound anti-CD3e for 5 and 24 h, respectively, with nuclei >6 µm in diameter (n=4–6). E, Correlation of Pearson between DAPI fluorescence intensity and nucleus diameter in T cells from a representative control mouse stimulated with anti-CD3e for 24 h. F, Percentage of T cells with nuclei >6 µm in diameter following treatment with 1 µM SB203580 (p38 inhibitor) or 1 µM U0126 (ERK inhibitor) for 5 h (n=3–5). G, Percentage of T cells with nuclei >6 µm in diameter following stimulation with 40 nM PMA and treatment with 1 µM SB203580 or 1 µM U0126 for 5 h (n=3–5). All experiments were repeated at least three times. Statistical differences were analyzed by Student’s t test, *p<0.05, **p<0.01, ***p<0.001.

