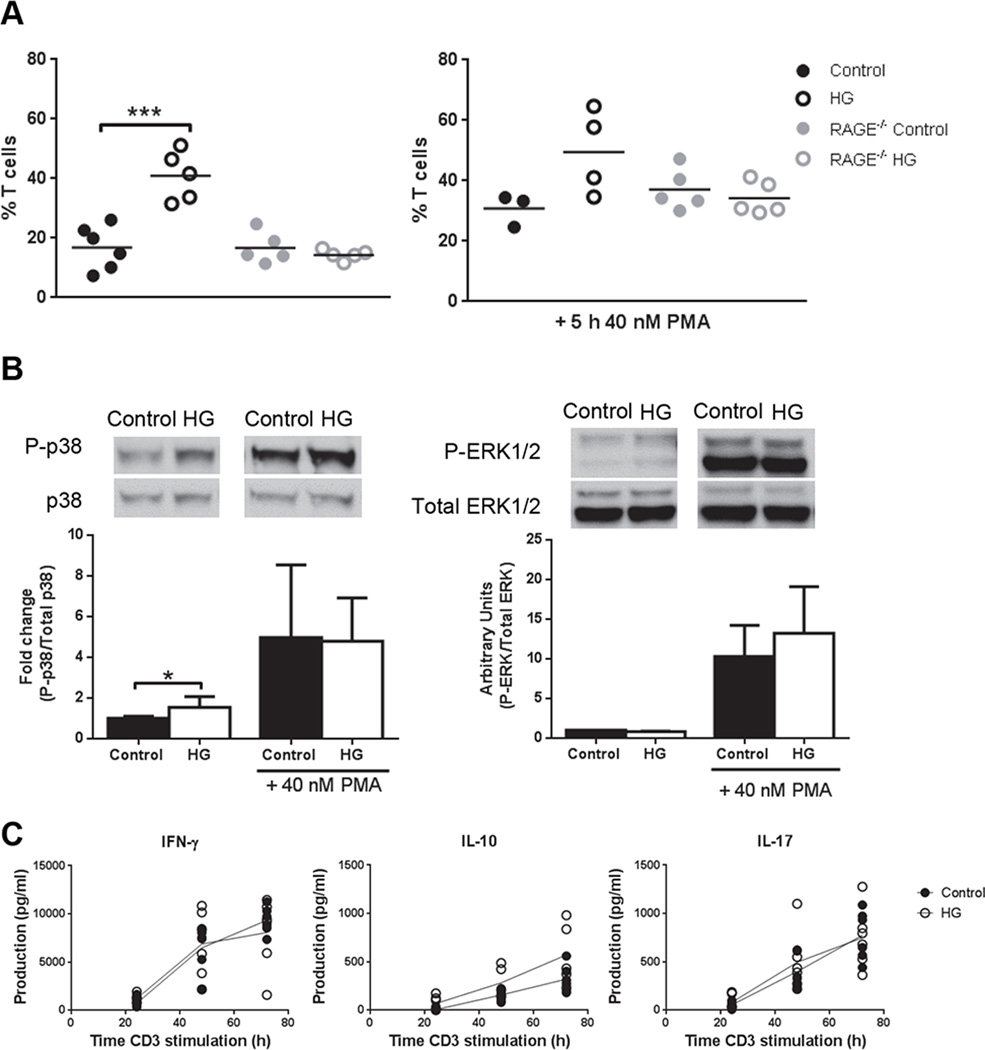
Figure 7. Chromatin decondensation, MAPK phosphorylation and cytokine production in T cells from control and HG RAGE−/− mice.
A, Percentage of T cells with nuclei >6 µm in diameter (n=5) from control or HG WT or RAGE−/− mice unstimulated (left graph) or stimulated with 40 nM PMA (right graph) for 5 h. B, p38 (left graph) and ERK1/2 (right graph) phosphorylation in T cells from control or HG RAGE−/− mice, unstimulated or stimulated with 40 nM PMA for 15 min (n=5). C, Production of IFN-γ, IL-10 and IL-17 in splenocytes from control or HG RAGE−/− mice stimulated with plate-bound anti-CD3e for 24, 48 and 72 h. All experiments were repeated at least twice. Statistical differences were analyzed by Student’s t test, *p<0.05, ***p<0.001.

