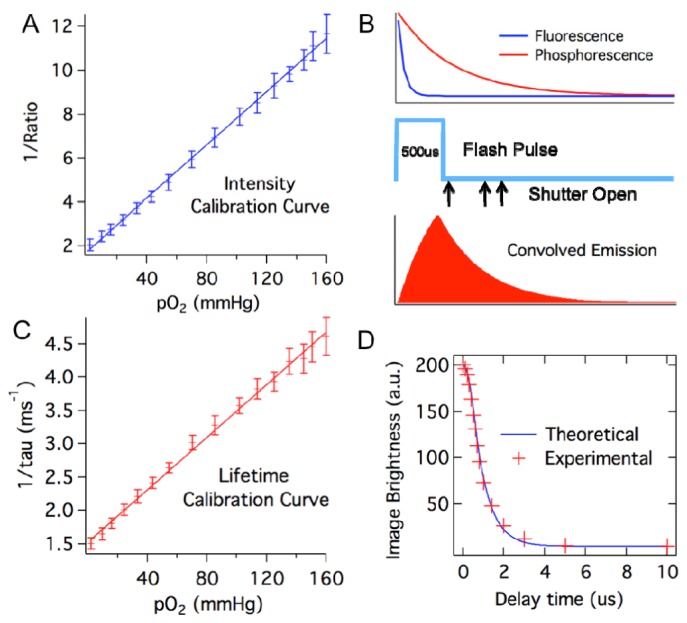
Fig. 2.

Calibrating the oxygen-sensing bandage. A) System calibration curve based on phosphorescence intensity. Phosphorescent intensity is expressed as red-to-green channel intensity ratio. B) Timing events during the imaging process, showing the 500 μs illumination flash pulse relative to the phosphorescence decay of the oxygen sensor and the fluorescence decay of the reference dye; the camera shutter opens after predetermined delay times following the flash pulse; and phosphorescence emission convolved with the flash pulse. C) System calibration curve based on phosphorescence lifetime. D) Comparison between calculated and experimentally measured image brightness at camera delay time between 0 and 10 ms for Oxyphor R2-containing bandage under 0 mmHg pO2. Calculation of image brightness was based on the assumption that the flash pulse is a square pulse with 500 μs pulse duration, and the phosphorescence lifetime of Oxyphor R2 under 0 mmHg pO2 is 700 μs.
