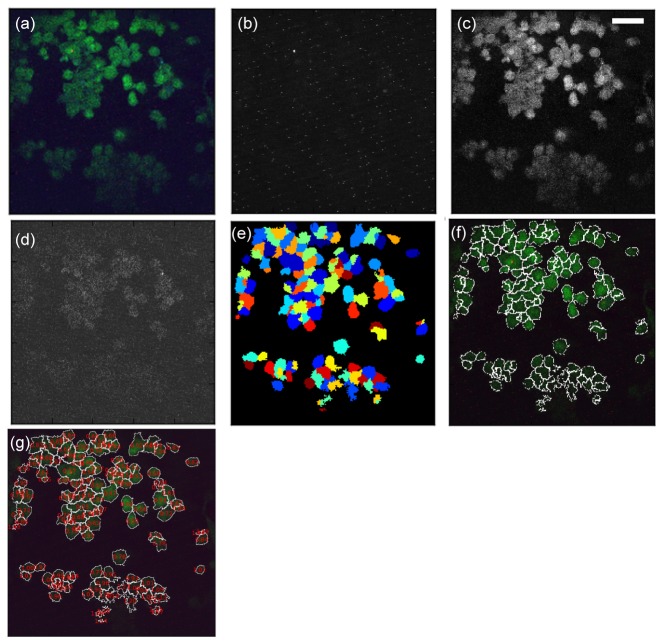
Fig. 2.
Image processing and cell identification. (a) Original RGB image. (b) Grayscale image from red channel. (c) Grayscale image from green channel. (d) Grayscale image from blue channel. (e) Binary image with identified cells. (f) Cells with demarcated boundaries (g) RGB image with calculated B/G ratio displayed. (bar: 50 μm)

