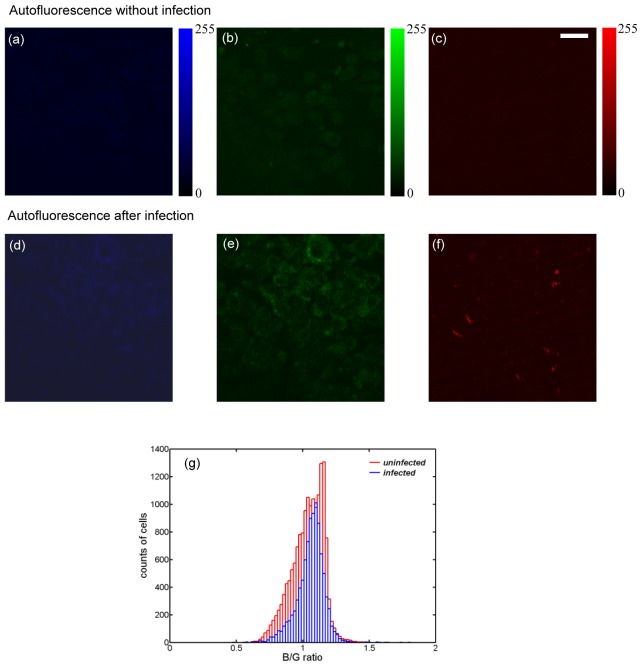
Fig. 4.
Cellular autofluorescence backgrounds are minimal in blue (a) & (d), green (b) & (d), and red (c) & (f) channels from the uninfected or the Mm-infected cells. (g) Histograms of blue/green ratio for the uninfected (red) and Mm-infected cells (blue) at 96 h post-infection. The total counted Mm-infected cells are 9430, and the total counted uninfected cells are 16010. (bar: 20 µm)

