

Abstract
The American healthcare system is at a crossroads, and analytics, as an organizational skill, figures to play a pivotal role in its future. As more healthcare systems capture information electronically and as they begin to collect more novel forms of data, such as human DNA, how will we leverage these resources and use them to improve human health at a manageable cost? In this article, we argue that analytics will play a fundamental role in the transformation of the American healthcare system. However, there are numerous challenges to the application and use of analytics, namely the lack of data standards, barriers to the collection of high-quality data, and a shortage of qualified personnel to conduct such analyses. There are also multiple managerial issues, such as how to get end users of electronic data to employ it consistently for improving healthcare delivery, and how to manage the public reporting and sharing of data. In this article, we explore applications of analytics in healthcare, barriers and facilitators to its widespread adoption, and how analytics can help us achieve the goals of the modern healthcare system: high-quality, responsive, affordable, and efficient care.
Keywords: healthcare, analytics, information technology
1. HEALTHCARE: AN INDUSTRY IN NEED OF ANALYTICS
The American healthcare system has long suffered from constrained resources, increasing demand, and questionable value, yet the future looks more promising due to increasingly sophisticated and widespread uses of data and analytics. Past performance of the healthcare system provides insight as to why change was necessary. The Centers for Medicare and Medicaid (CMS) estimate that healthcare is a staggering 17.9% of U.S. gross domestic product (GDP) and that the U.S. spent $2.7 trillion, or $8,680 per person, on healthcare in 2011 (CMS, 2013). According to the Organization for Economic Co-operation and Development (OECD), which ranks the performance of international healthcare systems, the U.S. ranked 27th in life expectancy at birth in 2009, despite having the highest proportion of GDP spent on healthcare (OECD, 2011).
This raises the question of value of the U.S. healthcare system. There are multiple reasons for this value deficit. First, the third-party-payer system decouples the payer from the individual receiving services, mitigating some checks and balances on costs. Second, there is a lack of aligned incentives in the existing fee-for-service system, which promotes consumption of resources and overuse rather than overall patient health and well-being. Third, there are unique barriers to competition not present in other industries that prevent innovation. Fourth, for-profit insurers, fraud, and waste divert a portion of healthcare funds away from paying for care. Finally, despite information technology’s (IT) role in rapidly advancing the productivity of many other industries (e.g., Rawley and Simcoe, 2012), IT adoption in healthcare has sorely lagged behind other industries.
While small steps toward reform were attempted, the Affordable Care Act (ACA) and the Health Information Technology for Economic and Clinical Health (HITECH) Act, a component of the American Recovery and Reinvestment Act (ARRA) of 2009, have initiated tremendous change in healthcare. Fueled by the carrot-and-stick approach of the HITECH Act, hospital adoption of at least a basic electronic health record (EHR) has nearly doubled from 2008 to 2012 with 44% of U.S. hospitals using at least a basic EHR (DesRoches, 2013). Without an EHR, much healthcare data are contained in paper format. Widespread EHR adoption sets the stage for electronic data collection and subsequent analysis. The next phase is to transform these data into actionable information packets that can be used to improve the delivery of healthcare.
Now that the necessary data pieces are being put into place, analytics can, and must, play a pivotal role in the transformation of American healthcare into an efficient, value-driven system. By investing in the implementation of healthcare information technology, and by shifting the focus from quantity of treatment to overall value in healthcare, the stage is set for the application of advanced analytics. As the ACA is implemented, incentives should be more in line with patient health and well-being while achieving value for limited healthcare resources.
While healthcare has taken longer than other industries to incorporate the use of analytics, such adoption is radically transforming the delivery of healthcare for the better. In this article, we will discuss how healthcare is fundamentally changing in response to the application of analytics. We will also discuss how data are collected, organized, and analyzed, as well as the challenges facing the widespread adoption of analytics in healthcare. We will also discuss managerial issues and how analytics can produce a meaningful output for organizations and individuals alike. Finally, we will conclude with specific examples illustrating the application of analytics to healthcare delivery. We will use examples from the visualization of data in quality improvement, genetics, comparative effectiveness, chronic disease databases, disaster planning, and asset tracking to demonstrate how the application of analytics to healthcare is improving the way that healthcare is delivered and to demonstrate the unique analytical issues it raises.
2. THE ANALYTICS PROCESS IN HEALTHCARE
2.1. Data Generation
There is a tendency for hospitals and healthcare systems to operate and manage a wide range of clinical and operational information systems. While the interoperability requirements of Meaningful Use (MU) (Blumenthal and Tavenner, 2010) are causing institutions to consolidate their clinical information systems into enterprise-wide EHRs, (Marsolo and Spooner, 2013) most institutions still rely on a host of platforms. Examples of such platforms are described below and summarized in Table 1, though it is not meant to be an exhaustive list. They include:
Table 1.
Example data sources within a healthcare delivery system.
| Data Source | Data Generated |
|---|---|
| Electronic Health Record (EHR) | Clinical documentation, patient history, results reporting, and patient orders. |
| Laboratory Information System (LIMS) | Laboratory results (the LIMS is typically interfaced with the EHR) |
| Diagnostic or monitoring instruments | Range from images (e.g., magnetic resonance imaging) to numbers (e.g., vital signs) to text report (result interpretation). May or may not be interfaced with the EHR. |
| Insurance claims / billing | Information on what was done to the patient during a visit, the cost of those services and the expected payment. The level of service is often determined from data in the EHR. |
| Pharmacy | Information on the fulfillment of medication orders. Not typically part of the EHR. |
| Human resources and supply chain | Lists of employees and their roles in the institution; location and utilization of medical supplies. Not typically interfaced with the EHR. |
| Real-time locating systems | Positions and interactions of assets and people |
Electronic Health Records (EHRs)
EHRs have become one of the largest sources of digital information on the health and well-being of patients. Spurred in part by the ARRA and MU, the rate of EHR adoption has grown dramatically (DesRoches, 2013; HealthIT Dashboard, 2013). EHRs are used to capture family, social, surgical, and medical history, allergies and immunizations, laboratory results, clinical findings, clinical orders, and other condition-specific information. Depending on the configuration of the EHR, this information may either exist in discrete fields or be captured as part of free-text notes (Marsolo and Spooner, 2013).
Laboratory Information Management System (LIMS)
a LIMS is used when processing laboratory samples, storing the interim and final results for a particular test. It typically contains sample metadata (collection date/time, container type, preservative, etc.) that are useful for quality assurance purposes.
Instruments used for diagnostic or monitoring purposes
These range from magnetic resonance imaging (MRI) or computed tomography (CT) scanners to echo- and electrocardiograms and vital sign monitors. The level of integration with these instruments will vary based on importance and the sophistication of the underlying system. Some instruments will simply generate a text report that is transmitted to the EHR. Others may produce images or other raw data that can be used for analytical purposes, or, like radiology picture archiving and communication systems (PACS), improve the management of these imaging databases.
Insurance claims / billing
these systems are used to generate bills for the services during each clinic or hospital visit and keep track of what was paid by patients, insurance providers, and other payers.
Pharmacy
until now, pharmacy information systems had rather limited uses involving inventory management. Pharmacy information systems are becoming increasingly sophisticated to address clinical problems such as medication non-adherence, a major reason for a lack of improvement in patient outcomes (Martin, 2005). In an outpatient setting, it is possible to determine whether an order was placed for a particular medication, but it is more challenging to determine whether the patient actually took the medication as prescribed. Pharmacy refills are being supplanted by electronic pill bottles as a better way of determining medication adherence (Aardex Group, 2012).
Human resources and supply chain
many healthcare systems now use typical enterprise-level IT systems (e.g., Peoplesoft or SAP) to manage their human resources (HR) and supply chains. These are typically not connected to the other systems mentioned previously in this section.
Real-time locating systems
increasingly, hospitals and large healthcare organizations are investing in systems that provide the real-time location of assets (e.g., intravenous pumps) and/or people (e.g., staff and patients) in order to better manage operations (Froehle and Magazine 2013). These systems locate the asset or person through some combination of wireless technologies, such as RFID, Wi-Fi, ultrasound, infrared, and GPS. Combined with management front-ends, these technologies can reduce loss and theft of assets and improve the situational awareness of staff who direct workflow.
2.2. Data Extraction
Most clinical information systems were not designed with analytics in mind and as such, do not necessarily make it easy to “get the data out.” Systems typically support data transmission using Health Level Seven (HL7) messages, (Health Level Seven International, 2013) but only a fraction of the total information in the system may be accessible using such an interface (Garrido 2013). Systems may also provide a back-end reporting database that can be used for research and analytics, but there may be a lag in how often that data is refreshed. Access to real-time data can be problematic. Typically, the only potential avenues available are (a) HL7, which limits the data that can be accessed and the types of questions that can be asked; and (b) web services, which provide a richer interface, but the details of which may be considered the intellectual property of the vendor and, therefore, may only be made available to its customers.
While there is no shortage of data standards in the healthcare industry, there is a distinct lack of uptake of those standards by the health IT community. Within a given clinical information system, vendors are free to define their own data structures, and often do. The same element may be stored and coded in myriad ways by vendors, and sometimes even within different systems from the same vendor. In one classic example, it was reported that there were over 40 different ways of capturing blood pressure within a single EHR (Koppel, 2013). All of them were valid within the clinical context in which the measurements were taken. The only standards that do exist are those that are tied to payment. That is why ICD-9 is used to code billing diagnoses (CMS, 2013), as they are required by CMS to receive payment from Medicare and Medicaid. That is also why the healthcare industry is preparing to move to ICD-10 in October 2014 (CMS, 2013).
Despite the challenges detailed above, efforts are underway to facilitate the sharing and exchange of data through standardization of data formats. The primary drivers behind this are the MU regulations. They call for clinical findings to be coded to SNOMED-CT (International Health Technology Standards Development Organisation, 2013), laboratory results to Logical Observation Identifiers Names and Codes or LOINC (LOINC, 2013), and medication orders to RxNorm (National Library of Medicine, 2013). Within the research community, such mappings are standard when performing inter-institutional analyses; making them standard will significantly reduce the burden of sharing data in a coherent fashion.
In addition to calling for the use of standard terminologies, another key element of MU is to increase the interoperability and exchange of EHR data (Blumenthal and Tavenner, 2010). In Phase 2, there are explicit measures to enable patients to view, download, and transmit (VDT) their results. Modeled after the Blue Button initiative (http://www.healthit.gov/bluebutton), which was started by several federal agencies to allow patients to view and download their personal health data, this is an attempt to put patients more in control of their health and their health data. Health systems will also be required to demonstrate the ability to exchange patient records with other health systems in their region, moving closer to the vision of patients having a single record that contains all of their health data. This means that it will become much easier to perform population-level analytics on the “standard” data elements that can be exchanged via these mechanisms (e.g., allergies, medication orders, surgical history, vital signs, and diagnoses).
2.3. Analysis
The application of analytics in healthcare requires the transformation of data into usable information that can be relayed back to end-users. The adoption of EHRs and other electronic data mechanisms makes the application of analytical tools more tractable by providing the basic electronic data upon which to act. This coincides with the rise of the “data scientist,” a term sometimes applied to those who use analytics and can serve as a one-stop shop for data management, analysis, and interpretation of electronic data. In healthcare, this is particularly important for translating electronic bits into meaningful data.
These data scientists often need to draw from a dizzyingly broad spectrum of analytical methodologies. Well-established techniques, such as biostatistics and epidemiologic analysis, Monte Carlo and discrete-event simulation, and causal modeling are being joined by methods previously uncommon in healthcare. These newer methods include data mining, Bayesian statistics, optimization modeling, social network analysis, and agent-based simulation, just to name a few.
Analysis is dependent upon the context in which it is being performed. Clinical care and performance improvement can require very different data perspectives and use the data in unique ways. Clinical analytics involves improving the care of patients. This type of data is very different than process-oriented data and may include genetic data as well as clinical records, which are often narrative and may be more difficult to analyze on a large scale. Performance data, on the other hand, may be subject to the issues described above, namely availability and quality. Considering that EHRs were not designed with system performance in mind, figuring out how to capture these data with high quality at a low cost is a daunting, yet fundamentally important, task.
2.4. Visualization and Reporting
Traditionally, healthcare has used business data far less regularly and comprehensively than most other industries. It has underinvested in advanced managerial technologies like reporting systems and data visualization. This may be partly due to some healthcare providers viewing investments in managerial and operational information systems as less important than investments in clinical information systems.
Whereas many organizations outside healthcare have developed or purchased real-time reporting systems that push targeted updates to specific end users, healthcare has typically relied on centralized production of static, undifferentiated report documents that provide the same view of historical performance to all recipients. Contemporary reporting systems often incorporate features such as interactive dashboards that provide customized, up-to-the-minute (or at least frequently updated) graphical displays of critical performance metrics, historical trends, and reference benchmarks or goals. These dashboards are designed to help the end user focus on those data that are most informative about how their systems are performing. In healthcare, decision-support dashboards are increasingly common on the clinical side, especially in EHR environments, but far less so when it comes to supporting managerial or operational decisions (Figure 1).
Figure 1.

A sample dashboard of emergency department performance measures. Used with permission from Emergency Medicine Business Intelligence.
One of the distinguishing features of many contemporary dashboards and analytical systems is the use of sophisticated visualization techniques. A growing amount of research has demonstrated that users make better decisions, or at least are more confident in the decisions they make, when data are provided to them in graphs or tables that are easy to interpret and understand (e.g., Tait et al., 2010). Advanced visualization techniques can provide more consistent, clean, and unambiguous charts that can improve the speed and reliability of users’ decision-making. Combining these advanced visualization methods with real-time dashboards can put unprecedented power in the hands of end users to better understand how key metrics are changing and what should be done to address problems.
3. PROBLEMS, CHALLENGES, BARRIERS AND ISSUES IN HEALTHCARE ANALYTICS
3.1. Managerial Issues
A key objective for any analytics system in healthcare is to produce a valuable output for those taking care of patients, doing research, or making other decisions about how the organization functions. For example, one of the core motivations for the recent massive investment in EHR infrastructure is the assumption that these systems will provide data to enable clinicians and researchers to develop better interventions, protocols, drugs, and policies that lead to improved patient outcomes.
In healthcare, the foremost concern for management is the people that compose it – the key stakeholders – be they patients, physicians, nurses, and other medical staff, referring providers, or representatives from the local community. Empowering these individuals and increasing the quality and transparency of decision-making are key goals for any business analytics initiative. Therefore, because of the pervasive influence these systems have, the organization needs to establish business analytics as an organizational and cultural objective, a component of its long-term strategy.
Such a culture would result in some fundamental improvements to the organization. First, decision-making based primarily on data and information would become the expectation and the norm. This is essential to complete the transformation to evidence-based medicine. Additionally, because data are shared and updated frequently, routine decisions can be more easily automated, or augmented with decision-support systems. Tools like CPOE systems that verify and validate medication orders in real time are but one example of the power and promise of analytics.
However, to realize these benefits, clinicians, support staff, and leadership all need to understand and appreciate the importance of business analytics as tools and as a fundamental process within the organization. Otherwise, the organization will continue to underinvest and staff will be skeptical of the value of recording data as a matter of course.
Another key managerial challenge is finding and retaining the personnel capable of performing these often complex analytical and data management tasks. A key issue that has limited the expansion of healthcare analytics has been a lack of qualified individuals with the appropriate background and skills in computing and mathematics to perform these analyses combined with the increasing demand for such individuals. McKinsey and Co. estimate that by 2018, the U.S. could face a shortage of 140,000 to 190,000 people with the appropriate analytical skills (McKinsey & Co., 2013).
Additional managerial issues involve the measurement of outcomes from the use of electronic data and their subsequent application to human health. Do they improve health? Do they save money? What metrics should be used to quantify their benefit or cost? Currently, there are no clear-cut answers (Manachemi, 2011, Mandl, 2012). To answer these questions, analytics will be necessary to determine the cost of the benefits achieved from such technology.
3.2. Data Quality
While it is a widely held belief that clinical information systems, and EHRs in particular, can serve as a rich source of data for analytical and research purposes, not all data are created equal. Some data elements are captured in a more consistent fashion and on a greater percentage of the patient population. Most EHRs are designed to allow the same piece of information to be captured in many different ways. A diagnosis, for instance, could be listed on the patient’s problem list, in their medical history, billing records, reason for visit, clinical narrative, etc. Institutions can implement best practices on where certain information is supposed to be documented on the patient’s chart and use quality improvement (QI) reports to ensure compliance (see below).
In most cases, however, when conducting population-level analytics, one needs to remember to look in all possible locations where data may exist. Otherwise, the user is left with the population who has data in the locations being searched. The latter approach introduces its own set of biases, but, in some cases, it may be sufficient (for example, ensuring that all patients with diabetes on their problem list are identified so they can have their Hemoglobin A1c levels checked versus trying to identify every patient in the hospital who might possibly be suspected of having diabetes). As a result, there is a growing awareness about the role of data quality in EHR-based analytics and a need to characterize the data’s “fitness for use” before utilizing it for any ancillary purposes (Weiskopf and Weng, 2013).
Another major challenge facing the use of analytics includes the availability and the cost of acquiring electronic data. A project to automate metric reporting at the integrated health system, Kaiser Permanente, found that the necessary electronic data were frequently not available for public reporting of system metrics (Garrido, 2013). This resulted in nearly $7 million in administrative costs to obtain and report these data. After implementing automated data reporting, Kaiser estimated that they reduced abstraction time by over 50% and saved approximately $1 million in administrative costs. However, just because data are collected does not mean that they are readily able to be mined. Some data may be in a clinical narrative that is more difficult to mine, requiring natural language processing algorithms to determine whether a particular action (e.g., smoking cessation) was performed. While discrete elements, such as check boxes, could be added to the user interface, this approach threatens to prolong the time a provider uses electronic tools (e.g., Poissant, 2005). Even when discrete fields are available, much electronic data are often incomplete (Staroselsky, 2006).
The standardization of data also raises another challenge:the accuracy of electronic data. EHRs may not improve, and may even worsen, data quality (Tse, 2011). For example, in one emergency department, EHR implementation increased the number of systematic errors during implementation compared to the legacy system (Ward, 2013). Compromised data quality poses risks for interpretation as well as any actions resulting from such data.
3.3. Data Collection
Data quality and the process of data collection are inextricably linked. Once data quality is compromised, it can be tremendously expensive to overcome; therefore it is critical to focus on high-quality data collection (Redman, HBR 2013). In healthcare, the generation of high-quality, useful data does not necessarily happen as a byproduct of the system. In the vast majority of cases, to produce high-quality data, someone needs to collect it. Therefore, workflows must be designed in a way that assures the important data elements will be captured during a visit and that these tasks minimally disrupt workflow, particularly expensive resources such as nurses and physicians. Even if this interaction is as trivial as a keypress, information processing theory tells us that burden can greatly undermine the consistency and quality of the data being collected (Payne, 1993).
Instead of collecting as much data as possible, institutions should actually take the opposite approach, ensuring that they collect on the minimal set of data elements that are required. It is far better to have a smaller set of high-quality elements with a high completion percentage instead of a large set with spotty coverage. There are ways that organizations can encourage employees to collect specific data elements, including publicizing the capture rates of individual employees within a clinic (anonymous or identified), tying a portion of salary to data entry compliance, and providing a tangible benefit from the collection of the data (e.g., the data that are captured can be used to automate a downstream process, saving time and effort).
There is only a certain amount of data that can be collected in any single visit. After a certain point, the data entry will increase the visit length to the point that it affects patient flow, potentially impacting patient satisfaction and revenues. As a result, another approach taken by an increasing number of organizations is to have patients take on a larger amount of the data entry burden. By providing kiosks or tablets to allow them to fill out forms in the waiting room or allowing them to enter the data at home through a patient portal, physicians simply need to review the responses instead of keying them in themselves (whether these patient-reported data are as complete or as of high quality as data provided by clinicians is an open question).
From an analytical perspective, this approach is limited by the quality of the data supplied by patients and is subject to recall bias. As one physician mentioned to us, “For example, when I ask a patient if they have any medical problems, I have had multiple patients respond ‘no,’ only to later see that they have human immunodeficiency virus (HIV) in their chart.” Another challenge posed by patient-entered data is that these responses are typically segregated in the EHR’s reporting database from those entered by clinicians. Even with a large percentage of patients entering data, clinicians will still need the ability to enter the same data elements through their EHR interfaces. Therefore, when using these data for analytical purposes, one must remember to merge both the patient-entered data tables with the clinician-entered ones in order to get a comprehensive dataset.
3.4. Competitive Concerns and Public Reporting
One of the most significant ongoing debates about analytics in healthcare involves the public reporting of results. The trend has been towards more transparency. CMS, for example, now provides a public report card of hospital quality measures (Hospital Compare, 2013) and there are numerous private initiatives to spur public reporting on quality and cost (James, 2012). There are competitive concerns about sharing quality and outcome data, so many institutions are reluctant to share data that are not required by federal or state regulations.
An innovative approach to sharing health data has been through the establishment of collaborative, multi-center, quality-improvement networks. These networks, such as Solutions for Patient Safety (Ohio Children’s Hospitals, 2013) and ImproveCareNow (Crandall et al., 2011), set goals such as eliminating patient harm and improving the care and outcomes of children with Inflammatory Bowel Disease (IBD). Another example of inter-institutional data sharing, the Emergency Department (ED) Benchmarking Alliance (http://www.edbenchmarking.org/) which allows member EDs to review and compare blinded operational data of similar type facilities. They define a set of outcome measures and standardize the collection of data. Center-level outcomes are shared within the collaborative and participants learn from those centers with the best outcomes. Metrics can be shared with the public while keeping the healthcare facility anonymous. Because many of the centers participating in the network are in competition with one another, the networks are largely built on trust and a sense of duty to the public good. By ensuring that no center’s results are used against them in a disparaging way, they are able to improve outcomes for the population as a whole.
3.5. Data Privacy and Governance
With the increased access and use of electronic data, privacy concerns are also increasing. Specifically, results that involve genetic data also require special consideration. The federal government has had a long-standing policy of making public as much as possible the genetic findings that were obtained with public research funding (NIH, 2013). That has led to the establishment of public databases like dbGaP (Mailman, 2007, Zhang, 2008) and international initiatives like the 1000 Genomes Project (Genomes Project, 2010). By nature, genetic information cannot be de-identified, but it was widely believed that the size and complexity of the data would at least confer some degree of anonymity. Recent studies have shown that such expectations are not valid (Gymrek, 2013), and, due to the concern of using genetic information to discriminate for employment or insurance purposes (despite it being illegal) (Pulley, 2012), there may be a move to decrease transparency when it comes to sharing genetic results.
Healthcare faces another managerial challenge that is not present in other industries, in that the use of data for research is governed by different rules than it is for non-research purposes. Federal regulations like the Health Insurance Portability and Accountability Act (HIPAA) and the Common Rule govern what data can be used for research, who may have access to that data, and the type of patient consent that may be required before access is granted. This poses challenges to analytical staff and their IT systems. In many cases, an organization may want to have a common set of business rules that are applied regardless of whether the data are used for clinical care, internal performance improvement, or research (as in the public reporting example above). If the logic for the business rules are encoded into the analytical system, the organization will either need to determine how to assign role-level access on that data to control who can see the data for research purposes or implement a completely stand-alone research infrastructure, which poses its own set of costs and challenges.
4. SPECIFIC EXAMPLES
As we have discussed, analytics have begun to improve and inform healthcare in many and varied ways. Some in particular have seen dramatic adoption or seem to present a potentially revolutionary approach to medical decision-making and the management of healthcare. These examples, and others, can be loosely grouped into two categories – discovery/efficacy and care delivery – as shown in Figure 2. We discuss several of these examples below.
Figure 2.
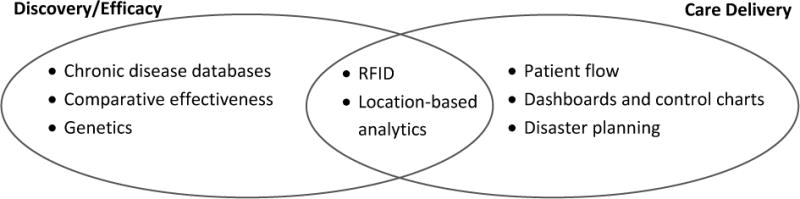
Some analytical areas and their contributions to healthcare
4.1. Dashboards and control charts
Dashboards and control charts are tools from QI science that are used to monitor outcomes and look for variations in process. Control charts consist of time series plots with upper- and lower-control limits. Based on certain criteria, data points outside the control limits may be deemed a special cause, which would indicate an improvement or deterioration in a particular process. Applied to healthcare, control charts are used to monitor outcomes, such as surgical site infections, remission rate, or operational metrics (e.g. patient wait times or room utilization).
4.2. Genetics
The integration of genetic data into routine healthcare practices provides tantalizing possibilities for the field of analytics. Private companies have begun providing straight-to-consumer testing on risk factors for certain genetic conditions. Some healthcare organizations have begun to prospectively genotype patients at risk for conditions where treatment involves medication that is metabolized differently depending on genotype (Pulley et al., 2012). The results are stored in the EHR and can be used to drive decision support around medication dosage should the patient develop the condition in question. Federally funded initiatives like the Electronic Medical Records and Genomics (eMERGE) Network seek to derive phenotypes from EHR data and use genomic analyses to determine if there is an underlying genetic basis that can be used to identify treatment (McCarty et al., 2011). While there is some controversy among the informatics and health IT community about how much genetic information should be stored in the EHR and how much control patients should have over those data (Masys et al., 2012),we are approaching the era of the $1,000 genome (Mardis, 2006),meaning we will soon be awash in genomic data. Given the incredible size and dimensionality of these datasets, the field of analytics will need to borrow techniques from large analytics companies like Google and Facebook, and from fields like astronomy and physics, to architect their solutions (Schatz and Langmead, 2013).
4.3. Cost of treatment and guiding investments
Borrowing from the field of comparative effectiveness (CE) research, analytics can also be applied in healthcare to compare the cost and effectiveness of interventions, treatments, public health policies,or medical devices. Organizations could use cost and outcome data to examine the performance of replacement hips, for instance, and stop utilizing those that perform worse (fail earlier) or cost more than others without providing improved patient outcomes. Similarly, organizations could stop prescribing medications that cost more without yielding a therapeutic benefit that justifies the cost. While CE research has become politically polarized in the United States in recent years, insurance companies routinely use the practice to decide what they will reimburse and in a time of decreasing federal budgets, healthcare organizations, which largely depend on those federal dollars, will be forced to do the same. This could force healthcare organizations to reconsider CE research, which has largely been a theoretical exercise, and to implement its findings.
4.4. Chronic disease databases
The vision of many within medicine is to move from our current health system to that of a learning health system (LHS), where every clinic visit provides an opportunity to generate new evidence and knowledge (Skiba, 2011; Slutsky, 2007). The Institute of Medicine (IOM) envisions an LHS in which healthcare, continuous improvement of healthcare, technological innovation, and research are all purposefully integrated. As one example of this vision, the ImproveCareNow network is developing a registry that is linked to the EHR, allowing data to be collected at the point of care and used for clinical support, QI, and research (Marsolo, 2013). This registry has allowed the network to: 1) create tools and processes to capture data directly from the EHR, improve the quality of information obtained during the patient encounter, and support the use of QI methods; 2) use the registry to automate pre-visit planning and population management activities and develop personalized software applications aimed at increasing patient participation (activation) in chronic care; 3) use data from the registry to conduct novel CE research by generating estimates of the comparative treatment effects of biologic agents; and, 4) develop governance and data sharing processes. Effective data capture and use of technology is foundational to make the LHS model work, but patients and clinicians must be sufficiently motivated and engaged to participate. As a result, the network is providing data, tools and support aimed at meeting the important needs of each of the stakeholders who contribute to the LHS and on using technology to reduce the time and effort required to participate.
4.5. Disaster planning
Another example where analytics could play a pivotal role is during disaster response. Disasters can take many forms. Simply put, a disaster is when demand for resources far outstrips available supply. They can include natural disasters such as a hurricane or snow storm, but can include infectious diseases, terrorist attacks, an airplane crash, or even a building collapse. Particularly in disasters, specific types of resources may be needed more than others. The key is matching appropriate resources with demand in order to mitigate harm and potential lost lives. For example, following a building collapse, dialysis machines are a specific resource in high demand since patients will go into kidney failure and the need for this equipment can quickly outstrip a hospital’s resources. Similarly, during influenza outbreaks, respiratory failure can require the use of ventilators to assist with breathing until a patient recovers. However, having real-time data on availability of such equipment and resources within a location (hospital, city, state or even region of the country) could enable resources to be organized more efficiently resulting in improved outcomes negating deleterious outcomes from delayed treatment. Another example is the use of Google Flu Trends for influenza (Google, 2013). Social media is also increasingly used to identify influenza-like illnesses to detect potential outbreaks before formal diagnoses are even made (Corley, 2010). The use of analytics tools allow patterns indicative of future outbreaks to be detected earlier before the situation gets out of hand, costs spiral, and lives are lost.
4.6. Patient flow
For decades, patient flow in healthcare facilities has been dependent upon experienced managers with no training in operations to predict arrival surges and the need for resources like patient beds. Physician and nurse staffing is frequently performed based upon provider preference rather than what the system requires. As healthcare utilization continues to increase and the number of entities and coordination needed amongst providers, patients, and their families becomes increasingly complex, “expertise” is no longer enough. Tools such as closed-form mathematical modeling, discrete-event simulation, and empirical/statistical analyses have been employed to improve patient flow, reduce waiting, and potentially improve patient outcomes (White and Froehle, 2011; Froehle and Magazine, 2013). Initially, these projects began as departmental-specific improvement projects, but have grown to encompass more and more of the complex systems they seek to represent. For example, several clinical disciplines have begun using approaches to predict resource use and downstream consequences. Emergency departments have used predictive models to predict and plan for excessive patient waiting, or crowding, how to staff and build an observation unit for patients that require abbreviated admissions, and the use of predictive models to plan for downstream inpatient bed use (Hoot, 2008, Lovejoy 2011, Peck, 2012). Internal medicine has used such tools to improve patient flow in outpatient ambulatory clinics (Chand, 2009). Intensive care units have used empirical analyses to identify that early discharges from the ICU often lead to rework in the form of readmissions to the ICU and subsequent clinical deterioration (KC, 2012). A study of cardiothoracic surgery found that workload is an important predictor of patient safety and service times and that peak performance cannot be sustained despite healthcare’s unwritten motto of “work harder” (KC, 2009). Healthcare is increasingly time-dependent and analytics plays a pivotal role in ensuring smooth patient flow and that patients with time-critical illnesses are cared for as soon as possible.
4.7. RFID
In addition to asset management, radiofrequency identification (RFID) is increasingly integrated into healthcare to provide real-time management, identification, and tracking of patients and staff (Yu, 2011; Ingrassia, 2012). This highly granular location data can be invaluable when modeling patient flow and care delivery processes. More novel uses are also being explored. RFID can be used to monitor compliance with hospital policies such as hand washing (Perna, 2013). Surgical patients can be evaluated for potential retained surgical equipment-a major source of morbidity and medicolegal risk through RFID-embedded equipment (Rogers, 2007). More than just patient flow and tracking, RFID holds potential for disease management as well. Patients with chronic diseases like diabetes and hypertension can be monitored for achieving specific numeric targets in their blood sugar and blood pressure, respectively, with minimal effort as smart devices embedded with RFID communicate to their providers (Moore, 2009). Elderly patients can be monitored to prevent falls (Ranashinghe, 2012). Prior to needing expensive healthcare resources like an emergency department visit or hospital admission, care coordination could potentially intervene and identify the reason for out of control values and return the patient to their normal state of health. These applications have unique analytics issues such as ensuring accuracy of data and how to handle the large quantities of data that were not previously available. Privacy issues can also be a concern for both patients and staff as individuals are tracked (Hawrylak, 2012).
5. CONCLUSION
Analytics is increasingly weaving itself into the fabric of healthcare and will fundamentally shape the future of medicine and care delivery. The number of applications seems to grow unabated. With opportunities such as the ability to improve the efficiency of healthcare while improving the quality of care, mine genetic data, reduce costs, effectively respond to disasters, and numerous other goals, the application of analytics is broad and far. However, such a vision will not be easily achieved. There are numerous challenges along the way. These issues include privacy concerns, the collection and availability of high quality data, data standards, the communication of data to end-users and even having enough qualified personnel to deliver on such promise. While formidable, these issues are not insurmountable. However, they are necessary to ensure that the application and understanding of analytics in healthcare will continue to grow and play an increasing role in healthcare systems of the future.
Contributor Information
Michael J. Ward, Email: michael.j.ward@vanderbilt.edu, Vanderbilt University, Department of Emergency Medicine, 1313 21st Avenue, 703 Oxford House, Nashville, TN 37232-4700, 615-936-8379 (phone), 615-936-3754 (fax).
Keith A. Marsolo, Email: Keith.Marsolo@cchmc.org, Cincinnati Children’s Hospital Medical Center, Division of Biomedical Informatics, 3333 Burnet Ave, Cincinnati, OH 45229-3026, 513-803-0333, University of Cincinnati, College of Medicine.
Craig M. Froehle, Email: craig.froehle@uc.edu, University of Cincinnati, Carl H. Lindner College of Business, 2925 Campus Green Drive, Cincinnati, OH 45221-0130, 513-556-7174, University of Cincinnati, College of Medicine, Cincinnati Children’s Hospital Medical Center, James M. Anderson Center for Health Systems Excellence.
References
- Aardex Group. MEMS – Medication Event Monitoring Systems. Retrieved June 20, 2012, from http://www.aardexgroup.com/index.php.
- Blumenthal D, Tavenner M. The “meaningful use” regulation for electronic health records. New England Journal of Medicine. 2010;363(6):501–504. doi: 10.1056/NEJMp1006114. [DOI] [PubMed] [Google Scholar]
- Centers of Medicare & Medicaid Services. International Classification of Diseases, Ninth Revision, Clinical Modification (ICD-9-CM) Retrieved April 11, 2013, from http://www.cms.gov/Medicare/Coding/ICD9ProviderDiagnosticCodes/index.html.
- Centers of Medicare & Medicaid Services. International Classification of Diseases, Ninth Revision, Clinical Modification (ICD-9-CM) ICD-10. Retrieved April 11, 2013, from http://www.cms.gov/Medicare/Coding/ICD10/index.html?redirect=/icd10.
- Centers of Medicare & Medicaid Services. National Health Expenditure Data 2011. Retrieved July 23, 2013, from http://www.cms.gov/Research-Statistics-Data-and-Systems/Statistics-Trends-and-Reports/NationalHealthExpendData/NHE-Fact-Sheet.html.
- Chand S, Moskowitz H, Norris JB, Shade S, Willis DR. Improving patient flow at an outpatient clinic: study of sources of variability and improvement factors. Health Care Manag Sci. 2009 Sep;12(3):325–40. doi: 10.1007/s10729-008-9094-3. [DOI] [PubMed] [Google Scholar]
- Corley CD, Cook DJ, Mikler AR, Singh KP. Using Web and social media for influenza surveillance. Adv Exp Med Biol. 2010;680:559–64. doi: 10.1007/978-1-4419-5913-3_61. [DOI] [PMC free article] [PubMed] [Google Scholar]
- Crandall W, Kappelman MD, Colletti RB, et al. ImproveCareNow: The Development of a Pediatric Inflammatory Bowel Disease Improvement Network. Inflamm Bowel Dis. 2011 Jan;17(1):450–457. doi: 10.1002/ibd.21394. [DOI] [PubMed] [Google Scholar]
- DesRoches CM, Charles D, Furukawa M, et al. Progress on Electronic Health Record Adoption Among U.S.Hospitals. Health Affairs (Millwood) 2013;32(8) doi: 10.1377/hlthaff.2013.0308. [DOI] [PubMed] [Google Scholar]
- Froehle CM, Magazine MJ. Improving Scheduling and Flow in Complex Outpatient Clinics. In: Denton B, editor. Handbook of Healthcare Operations Management: Methods and Applications. Springer; New York, NY: 2013. pp. 229–250. [Google Scholar]
- Garrido T, Kumar S, Lekas J, Lindberg M, Kadiyala D, Whippy A, Crawford B, Weissberg J. e-Measures: insight into the challenges and opportunities of automating publicly reported quality measures. J Am Med Inform Assoc. 2013 Jul 5; doi: 10.1136/amiajnl-2013-001789. [Epub ahead of print] [DOI] [PMC free article] [PubMed] [Google Scholar]
- Genomes Project. A map of human genome variation from population-scale sequencing. Nature. 2010;467(7319):1061–1073. doi: 10.1038/nature09534. [DOI] [PMC free article] [PubMed] [Google Scholar]
- Google Flu Trends. Retrieved July 18, 2013, from http://www.google.org/flutrends/us/#US.
- Gymrek M, McGuire AL, Golan D, Halperin E, Erlich Y. Identifying personal genomes by surname inference. Science. 2013 Jan 18;339(6117):321–324. doi: 10.1126/science.1229566. [DOI] [PubMed] [Google Scholar]
- Hawrylak PJ, Schimke N, Hale J, Papa M. Security risks associated with radio frequency identification in medical environments. J Med Syst. 2012 Dec;36(6):3491–505. doi: 10.1007/s10916-011-9792-0. [DOI] [PubMed] [Google Scholar]
- Health Level 7. Retrieved April 11, 2013, from http://www.hl7.org.
- HealthIT Dashboard 2013. Retrieved April 11, 2013, from http://dashboard.healthit.gov/
- Hoot NR, LeBlanc LJ, Jones I, Levin SR, Zhou C, Gadd CS, Aronsky D. Forecasting emergency department crowding: a discrete event simulation. Ann Emerg Med. 2008 Aug;52(2):116–25. doi: 10.1016/j.annemergmed.2007.12.011. [DOI] [PMC free article] [PubMed] [Google Scholar]
- Hospital Compare. Retrieved July 14, 2013, from http://www.medicare.gov/hospitalcompare.
- Ingrassia PL, Carenzo L, Barra FL, Colombo D, Ragazzoni L, Tengattini M, Prato F, Geddo A, Della Corte F. Data collection in a live mass casualty incident simulation: automated RFID technology versus manually recorded system. Eur J Emerg Med. 2012 Feb;19(1):35–9. doi: 10.1097/MEJ.0b013e328347a2c7. [DOI] [PubMed] [Google Scholar]
- James J. Health Policy Brief: Public Reporting on Quality and Costs. Health Affairs. 2012 Mar 8; Retrieved April 11, 2013, from http://healthaffairs.org/healthpolicybriefs/brief.php?brief_id=65.
- DS KC, Terwiesch C. An Econometric Analysis of Patient Flows in the Cardiac Intensive Care Unit. Manufacturing and Service Operations Management. 2012;14(1):50–65. [Google Scholar]
- DS KC, Terwiesch C. Impact of workload on service time and patient safety: an econometric analysis of hospital operations. Management Science. 2009;55(9):1486–1498. [Google Scholar]
- Koppel R. Usability: Present and Future. National Center for Cognitive Informatics & Decision Making. Retrieved July 14, 2013, from www.uthouston.edu/nccd/pre-amia-symposium/koppel.pdf.
- Logical Observation Identifiers Names and Codes. Retrieved April 11, 2013, from http://loinc.org.
- Lovejoy WS, Desmond JS. Little’s law flow analysis of observation unit impact and sizing. Acad Emerg Med. 2011 Feb;18(2):183–9. doi: 10.1111/j.1553-2712.2010.00969.x. [DOI] [PubMed] [Google Scholar]
- Mailman MD, Feolo M, Jin Y, et al. The NCBI dbGaP database of genotypes and phenotypes. Nature genetics. 2007 Oct;39(10):1181–1186. doi: 10.1038/ng1007-1181. [DOI] [PMC free article] [PubMed] [Google Scholar]
- Mandl KD, Kohane IS. Escaping the EHR trap—the future of health IT. N Engl J Med. 2012;366:2240–2. doi: 10.1056/NEJMp1203102. [DOI] [PubMed] [Google Scholar]
- Mardis ER. Anticipating the 1,000 dollar genome. Genome biology. 2006;7(7):112. doi: 10.1186/gb-2006-7-7-112. [DOI] [PMC free article] [PubMed] [Google Scholar]
- Marsolo K, Spooner SA. Clinical genomics in the world of the electronic health record. Genetics in medicine : official journal of the American College of Medical Genetics. 2013 Jul 11; doi: 10.1038/gim.2013.88. [DOI] [PMC free article] [PubMed] [Google Scholar]
- Marsolo Keith. In Search of a Data-in-Once, Electronic Health Record-Linked, Multicenter Registry— How Far We Have Come and How Far We Still Have to Go. eGEMs (Generating Evidence & Methods to improve patient outcomes) 2013;1(1):3. doi: 10.13063/2327-9214.1003. [DOI] [PMC free article] [PubMed] [Google Scholar]
- Martin LR, Williams SL, Haskard KB, Dimatteo MR. The challenge of patient adherence. Therapeutics and clinical risk management. 2005 Sep;1(3):189–199. [PMC free article] [PubMed] [Google Scholar]
- Masys DR, Jarvik GP, Abernethy NF, et al. Technical desiderata for the integration of genomic data into Electronic Health Records. Journal of biomedical informatics. 2012;45(3):419–422. doi: 10.1016/j.jbi.2011.12.005. [DOI] [PMC free article] [PubMed] [Google Scholar]
- McCarty CA, Chisholm RL, Chute CG, et al. The eMERGE Network: a consortium of biorepositories linked to electronic medical records data for conducting genomic studies. BMC medical genomics. 2011;4:13. doi: 10.1186/1755-8794-4-13. [DOI] [PMC free article] [PubMed] [Google Scholar]
- McKinsey and Company. Big data: The next frontier for innovation, competition, and productivity. 2011 May; Retrieved July 17, 2013, from http://www.mckinsey.com/~/media/McKinsey/dotcom/Insights%20and%20pubs/MGI/Research/Technology%20and%20Innovation/Big%20Data/MGI_big_data_full_report.ashx.
- Menachemi N, Collum TH. Benefits and drawbacks of electronic health record systems. Risk Manag Healthc Policy. 2011;4:47–55. doi: 10.2147/RMHP.S12985. [DOI] [PMC free article] [PubMed] [Google Scholar]
- Moore B. The potential use of radio frequency identification devices for active monitoring of blood glucose levels. J Diabetes Sci Technol. 2009 Jan;3(1):180–3. doi: 10.1177/193229680900300121. [DOI] [PMC free article] [PubMed] [Google Scholar]
- NIH Data Sharing Information. Retrieved 14, 2013, from http://grants.nih.gov/grants/policy/data_sharing/
- Organization for Economic Co-operation and Development. Health at a Glance 2011: OECD Indicators. OECD Publishing; Retrieved 17, 2013, from http://dx.doi.org/10.1787/health_glance-2011-enhttp://www.oecd.org/els/health-systems/49105858.pdf. [Google Scholar]
- Payne JW, Bettman JR, Johnson EJ. The adaptive decision maker. Cambridge; New York, NY, USA: Cambridge University Press; 1993. [Google Scholar]
- Peck JS, Benneyan JC, Nightingale DJ, Gaehde SA. Predicting emergency department inpatient admissions to improve same-day patient flow. Acad Emerg Med. 2012 Sep;19(9):E1045–54. doi: 10.1111/j.1553-2712.2012.01435.x. [DOI] [PubMed] [Google Scholar]
- Perna G. Shannon Medical Center. Leaders at one Texas-based hospital are not taking hand hygiene for granted. Healthc Inform. 2013 Feb;3028(1):30. [PubMed] [Google Scholar]
- Poissant L, Pereira J, Tamblyn R, Kawasumi Y. The Impact of Electronic Health Records on Time Efficiency of Physicians and Nurses: A Systematic Review. J Am Med Inform Assoc. 2005;12:505–516. doi: 10.1197/jamia.M1700. [DOI] [PMC free article] [PubMed] [Google Scholar]
- Pulley JM, Denny JC, Peterson JF, et al. Operational implementation of prospective genotyping for personalized medicine: the design of the Vanderbilt PREDICT project. Clinical pharmacology and therapeutics. 2012 Jul;92(1):87–95. doi: 10.1038/clpt.2011.371. [DOI] [PMC free article] [PubMed] [Google Scholar]
- Ranasinghe DC, Shinmoto Torres RL, Sample AP, Smith JR, Hill K, Visvanathan R. Towards falls prevention: a wearable wireless and battery-less sensing and automatic identification tag for real time monitoring of human movements. Conf Proc IEEE Eng Med Biol Soc. 2012;2012:6402–5. doi: 10.1109/EMBC.2012.6347459. [DOI] [PubMed] [Google Scholar]
- Rawley E, Simcoe TS. Information Technology, Productivity, and Asset Ownership: Evidence from Taxicab Fleets. Organization Science. 2012;24(3):831–845. [Google Scholar]
- Redman TC. Data’s Credibility Problem. Harvard Business Review. 2013 Dec; [Google Scholar]
- Rogers A, Jones E, Oleynikov D. Radio frequency identification (RFID) applied to surgical sponges. Surg Endosc. 2007 Jul;21(7):1235–7. doi: 10.1007/s00464-007-9308-7. Epub 2007 May 5. [DOI] [PubMed] [Google Scholar]
- RxNorm. Retrieved 11, 2013, from http://rxnav.nlm.nih.gov/
- Schatz MC, Langmead B. The DNA Data Deluge. IEEE Spectrum. doi: 10.1109/MSPEC.2013.6545119. Retrieved 11, 2013 from http://spectrum.ieee.org/biomedical/devices/the-dna-data-deluge. [DOI] [PMC free article] [PubMed]
- Skiba DJ. Informatics and the learning healthcare system. Nursing education perspectives Sep–Oct. 2011;32(5):334–336. doi: 10.5480/1536-5026-32.5.334. [DOI] [PubMed] [Google Scholar]
- Slutsky JR. Moving closer to a rapid-learning health care system. Health Aff (Millwood) 2007 Mar-Apr;26(2):w122–124. doi: 10.1377/hlthaff.26.2.w122. [DOI] [PubMed] [Google Scholar]
- SNOMED CT. Retrieved 11, 2013, from http://www.ihtsdo.org/snomed-ct/
- Solutions for Patient Safety. 2013 Retrieved 14, 2013, from http://solutionsforpatientsafety.org/
- Staroselsky M, Volk LA, Tsurikova R, Pizziferri L, Lippincott M, Wald J, Bates DW. Improving electronic health record (EHR) accuracy and increasing compliance with health maintenance clinical guidelines through patient access and input. Int J Med Inform. 2006 Oct-Nov;75:10–11. 693–700. doi: 10.1016/j.ijmedinf.2005.10.004. [DOI] [PubMed] [Google Scholar]
- Tait AR, Voepel-Lewis T, Zikmund-Fisher BJ. The Effect of Format on Parents’ Understanding of the Risks and Benefits of Clinical Research: A Comparison Between Text, Tables, and Graphics. Journal of Health Communication: International Perspectives. 2010;15(5):487–501. doi: 10.1080/10810730.2010.492560. [DOI] [PMC free article] [PubMed] [Google Scholar]
- Tse J, You W. How accurate is the electronic health record? – a pilot study evaluating information accuracy in a primary care setting. Stud Health Technol Inform. 2011;168:158–64. [PubMed] [Google Scholar]
- Ward MJ, Froehle CM, Hart KW, Lindsell CJ. Operational data integrity during electronic health record implementation in the ED. Am J Emerg Med. 2013 Jul;31(7):1029–33. doi: 10.1016/j.ajem.2013.03.027. [DOI] [PubMed] [Google Scholar]
- Weiskopf NG, Weng C. Methods and dimensions of electronic health record data quality assessment: enabling reuse for clinical research. J Am Med Inform Assoc. 2013 Jan 1;20(1):144–151. doi: 10.1136/amiajnl-2011-000681. [DOI] [PMC free article] [PubMed] [Google Scholar]
- White DL, Froehle F, Klassen KJ. The effect of integrated scheduling and capacity planning on clinical efficiency. Production and Operations Mgmt. 2011;20(3):442–455. [Google Scholar]
- Yu X, Ganz A. Scalable patients tracking framework for mass casualty incidents. Conf Proc IEEE Eng Med Biol Soc. 2011:860–3. doi: 10.1109/IEMBS.2011.6090224. [DOI] [PubMed] [Google Scholar]
- Zhang H, Morrison MA, Dewan A, et al. The NEI/NCBI dbGAP database: genotypes and haplotypes that may specifically predispose to risk of neovascular age-related macular degeneration. BMC medical genetics. 2008;9:51. doi: 10.1186/1471-2350-9-51. [DOI] [PMC free article] [PubMed] [Google Scholar]