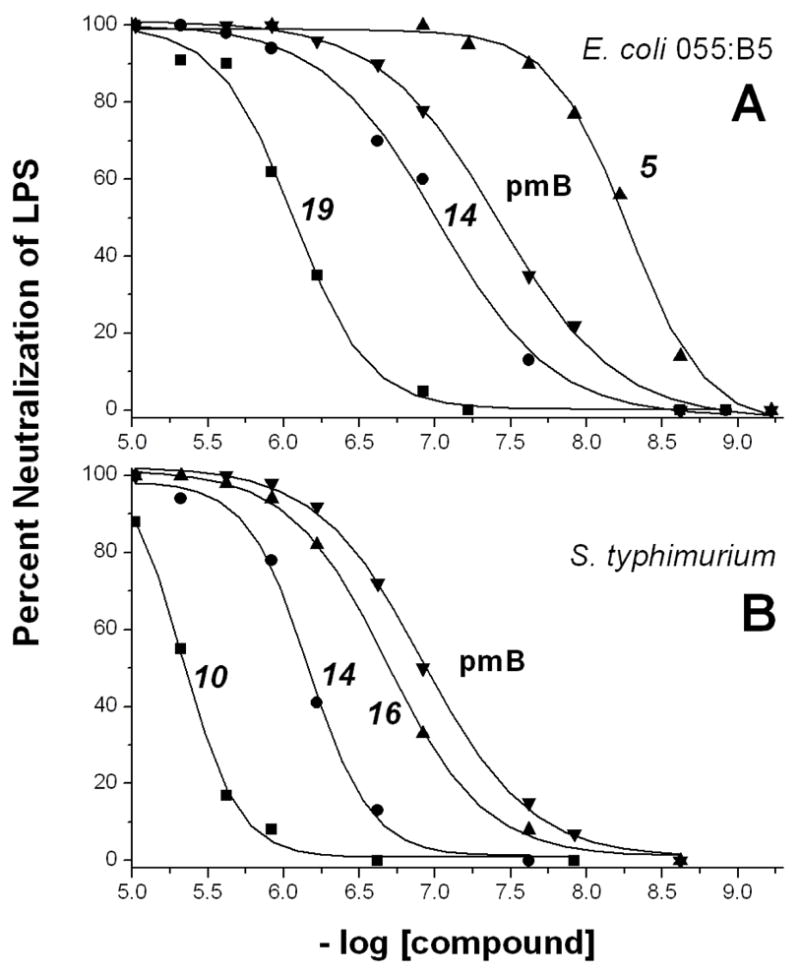
Figure 3.

Examples of dose response curves for endotoxin neutralization. Several dose response curves for LPS neutralization are shown for some of the sheet/helix mimetics listed in Table 1. Symbols indicate actual data points, and lines are the best fit of a sigmoidal function to the data points. For all compounds listed in Table 1, IC50 values have been derived from dose response curves fitted similarly.
